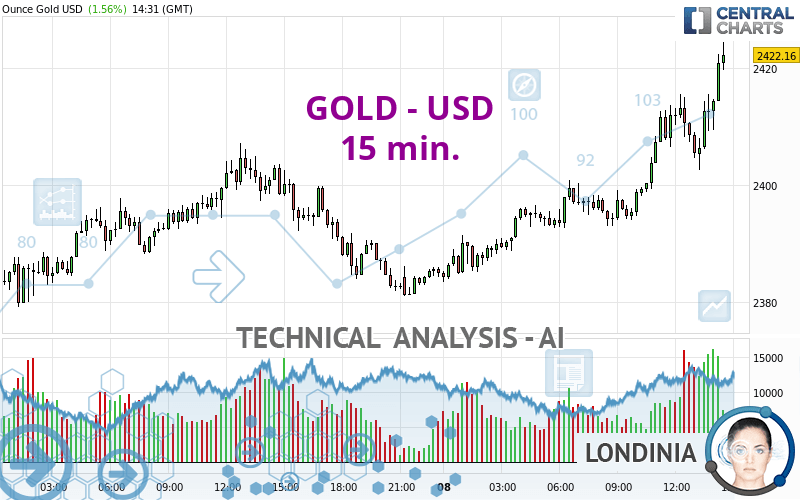
GOLD - USD - 15 min. - Technical analysis published on 08/08/2024 (GMT)
- Who voted?
- 153
- 0
Click here for a new analysis!
- Timeframe : 15 min.
- - Analysis generated on
- Status : LEVEL MAINTAINED

Summary of the analysis

Additional analysis
Quotes
The GOLD - USD rating is 2,422.69 USD. On the day, this instrument gained +1.59% and was between 2,383.27 USD and 2,424.40 USD. This implies that the price is at +1.65% from its lowest and at -0.07% from its highest.The Central Gaps scanner detects a bearish opening marking the presence of sellers ahead of buyers at the opening but not sufficiently marked to allow the price to register a quotation gap.
Bearish opening
Type : Bearish
Timeframe : Openning
A study of price movements over other periods shows the following variations:
Near a new HIGH record (5 years)
Type : Bullish
Timeframe : Weekly
Near a new HIGH record (1 year)
Type : Bullish
Timeframe : Weekly
Near a new HIGH record (1st january)
Type : Bullish
Timeframe : Weekly
Near a new HIGH record (1 month)
Type : Bullish
Timeframe : Weekly
Technical
Technical analysis of GOLD - USD in 15 min. shows a strongly overall bullish trend. 92.86% of the signals given by moving averages are bullish. The overall trend is supported by the strong bullish signals from short-term moving averages. The Central Indicators market scanner currently does not detect any result that concerns moving averages.
The probability of a further increase is high given the direction of the technical indicators.
But beware of excesses. The Central Indicators scanner currently detects this:
RSI indicator is overbought : over 70
Type : Neutral
Timeframe : 15 minutes
CCI indicator is overbought : over 100
Type : Neutral
Timeframe : 15 minutes
MACD indicator: bearish divergence
Type : Bearish
Timeframe : 15 minutes
Williams %R indicator is overbought : over -20
Type : Neutral
Timeframe : 15 minutes
Pivot points : price is over resistance 1
Type : Neutral
Timeframe : 15 minutes
Price is back under the pivot point
Type : Bearish
Timeframe : Weekly
Central Patterns, the scanner specializing in chart patterns, did not identify any signals.
The presence of these Japanese chandelier patterns detected by Central Candlesticks that could impact the current short-term trend were also noted:
Bearish harami
Type : Bearish
Timeframe : 15 minutes
Bullish engulfing lines
Type : Bullish
Timeframe : 15 minutes
Bearish harami cross
Type : Bearish
Timeframe : 15 minutes
| S3 | S2 | S1 | Price | R1 | R2 | R3 | |
|---|---|---|---|---|---|---|---|
| ProTrendLines | 2,362.61 | 2,379.06 | 2,407.12 | 2,422.69 | 2,426.21 | 2,458.65 | 2,468.36 |
| Change (%) | -2.48% | -1.80% | -0.64% | - | +0.15% | +1.48% | +1.89% |
| Change | -60.08 | -43.63 | -15.57 | - | +3.52 | +35.96 | +45.67 |
| Level | Major | Intermediate | Intermediate | - | Intermediate | Intermediate | Intermediate |
Pivot points can also be used to set your price objectives. Here is the price situation in relation to pivot points:
| Pivot points | S3 | S2 | S1 | PP | R1 | R2 | R3 |
|---|---|---|---|---|---|---|---|
| Standard | 2,345.54 | 2,362.30 | 2,373.60 | 2,390.36 | 2,401.66 | 2,418.42 | 2,429.72 |
| Camarilla | 2,377.18 | 2,379.76 | 2,382.33 | 2,384.90 | 2,387.47 | 2,390.04 | 2,392.62 |
| Woodie | 2,342.81 | 2,360.94 | 2,370.87 | 2,389.00 | 2,398.93 | 2,417.06 | 2,426.99 |
| Fibonacci | 2,362.30 | 2,373.02 | 2,379.64 | 2,390.36 | 2,401.08 | 2,407.70 | 2,418.42 |
| Pivot points | S3 | S2 | S1 | PP | R1 | R2 | R3 |
|---|---|---|---|---|---|---|---|
| Standard | 2,274.63 | 2,322.18 | 2,382.61 | 2,430.16 | 2,490.59 | 2,538.14 | 2,598.57 |
| Camarilla | 2,413.35 | 2,423.24 | 2,433.14 | 2,443.04 | 2,452.94 | 2,462.84 | 2,472.74 |
| Woodie | 2,281.07 | 2,325.40 | 2,389.05 | 2,433.38 | 2,497.03 | 2,541.36 | 2,605.01 |
| Fibonacci | 2,322.18 | 2,363.43 | 2,388.91 | 2,430.16 | 2,471.41 | 2,496.89 | 2,538.14 |
| Pivot points | S3 | S2 | S1 | PP | R1 | R2 | R3 |
|---|---|---|---|---|---|---|---|
| Standard | 2,183.11 | 2,250.83 | 2,348.31 | 2,416.03 | 2,513.51 | 2,581.23 | 2,678.71 |
| Camarilla | 2,400.37 | 2,415.51 | 2,430.66 | 2,445.80 | 2,460.94 | 2,476.09 | 2,491.23 |
| Woodie | 2,198.00 | 2,258.27 | 2,363.20 | 2,423.47 | 2,528.40 | 2,588.67 | 2,693.60 |
| Fibonacci | 2,250.83 | 2,313.93 | 2,352.92 | 2,416.03 | 2,479.13 | 2,518.12 | 2,581.23 |
Numerical data
The following is the status of technical indicators and moving averages registered at the time this technical analysis was created:
| RSI (14): | 61.49 | |
| MACD (12,26,9): | 4.2200 | |
| Directional Movement: | 12.81 | |
| AROON (14): | 50.00 | |
| DEMA (21): | 2,412.90 | |
| Parabolic SAR (0,02-0,02-0,2): | 2,402.69 | |
| Elder Ray (13): | 2.72 | |
| Super Trend (3,10): | 2,402.91 | |
| Zig ZAG (10): | 2,412.00 | |
| VORTEX (21): | 1.1700 | |
| Stochastique (14,3,5): | 91.68 | |
| TEMA (21): | 2,415.18 | |
| Williams %R (14): | -0.16 | |
| Chande Momentum Oscillator (20): | 9.42 | |
| Repulse (5,40,3): | 0.6500 | |
| ROCnROLL: | 1 | |
| TRIX (15,9): | 0.0300 | |
| Courbe Coppock: | 0.98 |
| MA7: | 2,418.57 | |
| MA20: | 2,413.97 | |
| MA50: | 2,368.90 | |
| MA100: | 2,346.86 | |
| MAexp7: | 2,414.28 | |
| MAexp20: | 2,407.66 | |
| MAexp50: | 2,401.28 | |
| MAexp100: | 2,397.70 | |
| Price / MA7: | +0.17% | |
| Price / MA20: | +0.36% | |
| Price / MA50: | +2.27% | |
| Price / MA100: | +3.23% | |
| Price / MAexp7: | +0.34% | |
| Price / MAexp20: | +0.62% | |
| Price / MAexp50: | +0.89% | |
| Price / MAexp100: | +1.04% |
News
The latest news and videos published on GOLD - USD at the time of the analysis were as follows:
-
 Gold Daily Forecast and Technical Analysis for August 07, 2024 by Bruce Powers, CMT, FX Empire
-
Gold Forecast August 8, 2024
-
Gold, Looking for Stability: XAU/USD Technical Analysis for by Chris Lewis for FX Empire (08/07)
-
Gold Looks for Stability: Technical Analysis for August 07, 2024, by Chris Lewis for FX Empire
-
Winning gold in Men's Trap 'unbelievable’
About author

Online


Add a comment
Comments
0 comments on the analysis GOLD - USD - 15 min.