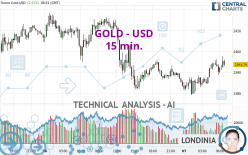
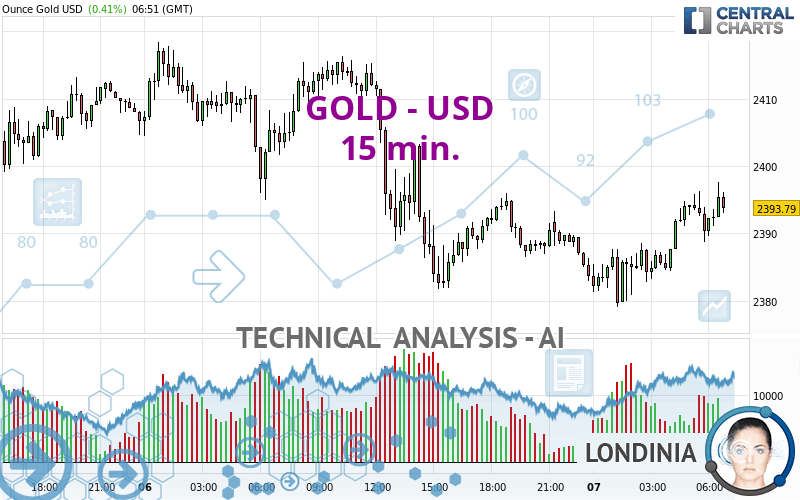
GOLD - USD - 15 min. - Technical analysis published on 08/07/2024 (GMT)
- 100
- 0
Click here for a new analysis!
- Timeframe : 15 min.
- - Analysis generated on
- Status : LEVEL MAINTAINED
Summary of the analysis

Additional analysis
Quotes
The GOLD - USD price is 2,393.77 USD. The price has increased by +0.41% since the last closing with the lowest point at 2,379.06 USD and the highest point at 2,397.66 USD. The deviation from the price is +0.62% for the low point and -0.16% for the high point.The Central Gaps scanner detects a bearish opening marking the presence of sellers ahead of buyers at the opening but not sufficiently marked to allow the price to register a quotation gap.
Bearish opening
Type : Bearish
Timeframe : Openning
Here is a more detailed summary of the historical variations registered by GOLD - USD:
Near a new HIGH record (5 years)
Type : Bullish
Timeframe : Weekly
Near a new HIGH record (1 year)
Type : Bullish
Timeframe : Weekly
Near a new HIGH record (1st january)
Type : Bullish
Timeframe : Weekly
Near a new HIGH record (1 month)
Type : Bullish
Timeframe : Weekly
Technical
Technical analysis of GOLD - USD in 15 min. shows an overall slightly bullish trend. Only 60.71% of the signals given by moving averages are bullish. This slightly bullish trend is reinforced by the strong signals currently being given by short-term moving averages. The Central Indicators scanner detects bullish and bearish signals on moving averages that could impact this trend:
Bullish trend reversal : adaptative moving average 100
Type : Bullish
Timeframe : 15 minutes
Bearish price crossover with Moving Average 100
Type : Bearish
Timeframe : 15 minutes
An assessment of technical indicators shows a strong bullish signal.
Caution: the Central Indicators scanner currently detects an excess:
CCI indicator: bearish divergence
Type : Bearish
Timeframe : 15 minutes
RSI indicator: bearish divergence
Type : Bearish
Timeframe : 15 minutes
Price is back under the pivot point
Type : Bearish
Timeframe : 15 minutes
Price is back under the pivot point
Type : Bearish
Timeframe : Weekly
No signals are given by Central Patterns, a market scanner specialised in chart patterns, resistances and supports.
For a small setback in the very short term, the Central Candlesticks scanner currently notes the presence of this bearish pattern in Japanese candlesticks:
Bearish harami
Type : Bearish
Timeframe : 15 minutes
| S3 | S2 | S1 | Price | R1 | R2 | R3 | |
|---|---|---|---|---|---|---|---|
| ProTrendLines | 2,294.05 | 2,362.61 | 2,383.44 | 2,393.77 | 2,396.28 | 2,426.21 | 2,458.65 |
| Change (%) | -4.17% | -1.30% | -0.43% | - | +0.10% | +1.36% | +2.71% |
| Change | -99.72 | -31.16 | -10.33 | - | +2.51 | +32.44 | +64.88 |
| Level | Intermediate | Major | Minor | - | Major | Intermediate | Minor |
To determine price objectives, it is also possible to use the pivot points. Here is the price position in relation to pivot points:
| Pivot points | S3 | S2 | S1 | PP | R1 | R2 | R3 |
|---|---|---|---|---|---|---|---|
| Standard | 2,334.35 | 2,358.05 | 2,371.00 | 2,394.70 | 2,407.65 | 2,431.35 | 2,444.30 |
| Camarilla | 2,373.87 | 2,377.23 | 2,380.59 | 2,383.95 | 2,387.31 | 2,390.67 | 2,394.03 |
| Woodie | 2,328.98 | 2,355.36 | 2,365.63 | 2,392.01 | 2,402.28 | 2,428.66 | 2,438.93 |
| Fibonacci | 2,358.05 | 2,372.05 | 2,380.70 | 2,394.70 | 2,408.70 | 2,417.35 | 2,431.35 |
| Pivot points | S3 | S2 | S1 | PP | R1 | R2 | R3 |
|---|---|---|---|---|---|---|---|
| Standard | 2,274.63 | 2,322.18 | 2,382.61 | 2,430.16 | 2,490.59 | 2,538.14 | 2,598.57 |
| Camarilla | 2,413.35 | 2,423.24 | 2,433.14 | 2,443.04 | 2,452.94 | 2,462.84 | 2,472.74 |
| Woodie | 2,281.07 | 2,325.40 | 2,389.05 | 2,433.38 | 2,497.03 | 2,541.36 | 2,605.01 |
| Fibonacci | 2,322.18 | 2,363.43 | 2,388.91 | 2,430.16 | 2,471.41 | 2,496.89 | 2,538.14 |
| Pivot points | S3 | S2 | S1 | PP | R1 | R2 | R3 |
|---|---|---|---|---|---|---|---|
| Standard | 2,183.11 | 2,250.83 | 2,348.31 | 2,416.03 | 2,513.51 | 2,581.23 | 2,678.71 |
| Camarilla | 2,400.37 | 2,415.51 | 2,430.66 | 2,445.80 | 2,460.94 | 2,476.09 | 2,491.23 |
| Woodie | 2,198.00 | 2,258.27 | 2,363.20 | 2,423.47 | 2,528.40 | 2,588.67 | 2,693.60 |
| Fibonacci | 2,250.83 | 2,313.93 | 2,352.92 | 2,416.03 | 2,479.13 | 2,518.12 | 2,581.23 |
Numerical data
The following is the status of the technical indicators and moving averages at the time of publication of this technical analysis:
| RSI (14): | 65.45 | |
| MACD (12,26,9): | 2.1400 | |
| Directional Movement: | 8.24 | |
| AROON (14): | 92.86 | |
| DEMA (21): | 2,393.72 | |
| Parabolic SAR (0,02-0,02-0,2): | 2,388.83 | |
| Elder Ray (13): | 3.77 | |
| Super Trend (3,10): | 2,385.52 | |
| Zig ZAG (10): | 2,395.21 | |
| VORTEX (21): | 1.2100 | |
| Stochastique (14,3,5): | 81.63 | |
| TEMA (21): | 2,395.71 | |
| Williams %R (14): | -14.42 | |
| Chande Momentum Oscillator (20): | 9.42 | |
| Repulse (5,40,3): | 0.1700 | |
| ROCnROLL: | 1 | |
| TRIX (15,9): | 0.0100 | |
| Courbe Coppock: | 0.73 |
| MA7: | 2,418.22 | |
| MA20: | 2,414.40 | |
| MA50: | 2,367.64 | |
| MA100: | 2,344.83 | |
| MAexp7: | 2,393.75 | |
| MAexp20: | 2,391.21 | |
| MAexp50: | 2,390.77 | |
| MAexp100: | 2,395.18 | |
| Price / MA7: | -1.01% | |
| Price / MA20: | -0.85% | |
| Price / MA50: | +1.10% | |
| Price / MA100: | +2.09% | |
| Price / MAexp7: | +0.00% | |
| Price / MAexp20: | +0.11% | |
| Price / MAexp50: | +0.13% | |
| Price / MAexp100: | -0.06% |
News
The latest news and videos published on GOLD - USD at the time of the analysis were as follows:
-
 Team USA racks up more gold at Paris Olympics
-
Gold Consolidates: Technical Analysis for August 06, 2024 by Bruce Powers, CMT, FX Empire
-
Paralympian Steve Serio Is Winning Gold On And Off The Court
-
Keely Hodgkinson on winning 800m gold
-
Gold Shows Signs of Life: Technical Analysis for August 06, 2024, by Chris Lewis for FX Empire
About author

Online


Add a comment
Comments
0 comments on the analysis GOLD - USD - 15 min.