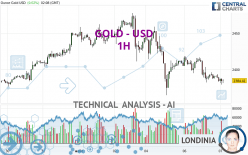
GOLD - USD - 1H - Technical analysis published on 08/07/2024 (GMT)
- 122
- 0
Oops, I was wrong about that analysis. My threshold for invalidation has been broken.
Click here for a new analysis!
Click here for a new analysis!
- Timeframe : 1H
- - Analysis generated on
- Status : INVALID

Summary of the analysis
Trends
Short term:
Strongly bearish
Underlying:
Strongly bearish
Technical indicators
11%
67%
22%
My opinion
Bearish under 2,396.28 USD
My targets
2,362.61 USD (-0.91%)
2,294.05 USD (-3.79%)
My analysis
All elements being clearly bearish, it would be possible for traders to trade only short positions (for sale) on GOLD - USD as long as the price remains well below 2,396.28 USD. The sellers' bearish objective is set at 2,362.61 USD. A bearish break of this support would revive the bearish momentum. The sellers could then target the support located at 2,294.05 USD. In case of crossing, the next objective would be the support located at 2,049.28 USD. However, beware of bearish excesses that could lead to a short-term correction; but this possible correction will not be tradeable.
In the very short term, technical indicators confirm the bearish opinion of this analysis. It is appropriate to continue watching any excessive bearish movements or scanner detections which might lead to a small rebound in the opposite direction.
Force
0
10
7.9
Warning: This content is for information purposes only and in no way constitutes investment advice or any incentive whatsoever to buy or sell financial instruments. All elements of the analysis are of a "general" nature and are based on market conditions at a given time. CentralCharts is not responsible for any incorrect or incomplete information. Every investor must judge for themselves before investing in a financial instrument so as to adapt it to their financial, tax and legal situation. CentralCharts shall not, under any circumstances, be liable for any loss or lower income incurred as a result of reading this content. Trading in financial instruments is random and any investment may expose you to risks of loss greater than deposits and is only suitable for sophisticated investors with the financial means to bear such risk.

This analysis was given by shadybhai. Take part yourself by sharing additional analysis on another time unit:
Additional analysis
Quotes
The GOLD - USD price is 2,384.41 USD. The price has increased by +0.02% since the last closing and was traded between 2,379.06 USD and 2,387.66 USD over the period. The price is currently at +0.22% from its lowest and -0.14% from its highest.2,379.06
2,387.66
2,384.41
The Central Gaps scanner detects a bearish opening. A small advantage for sellers in the very short term.
Bearish opening
Type : Bearish
Timeframe : Openning
A study of price movements over other periods shows the following variations:
Near a new HIGH record (5 years)
Type : Bullish
Timeframe : Weekly
Near a new HIGH record (1 year)
Type : Bullish
Timeframe : Weekly
Near a new HIGH record (1st january)
Type : Bullish
Timeframe : Weekly
Near a new HIGH record (1 month)
Type : Bullish
Timeframe : Weekly
Technical
Technical analysis of this 1H chart of GOLD - USD indicates that the overall trend is strongly bearish. 92.86% of the signals given by moving averages are bearish. This strongly bearish trend is supported by the strong bearish signals given by short-term moving averages. There is no crossing of moving average by the price or crossing of moving averages between themselves.
In fact, 12 technical indicators on 18 studied are currently bearish. Caution: the Central Indicators scanner currently detects an excess:
MACD indicator: bullish divergence
Type : Bullish
Timeframe : 1 hour
Williams %R indicator is oversold : under -80
Type : Neutral
Timeframe : 1 hour
Price is back under the pivot point
Type : Bearish
Timeframe : Weekly
No signals are given by Central Patterns, a market scanner specialised in chart patterns, resistances and supports.
For a small rebound in the very short term, the Central Candlesticks scanner currently notes the presence of this bullish pattern in Japanese candlesticks:
Bullish harami
Type : Bullish
Timeframe : 1 hour
ProTrendLines
S3
S2
S1
R1
R2
R3
Price
| S3 | S2 | S1 | Price | R1 | R2 | R3 | |
|---|---|---|---|---|---|---|---|
| ProTrendLines | 2,294.05 | 2,362.61 | 2,383.44 | 2,384.41 | 2,396.28 | 2,426.21 | 2,458.65 |
| Change (%) | -3.79% | -0.91% | -0.04% | - | +0.50% | +1.75% | +3.11% |
| Change | -90.36 | -21.80 | -0.97 | - | +11.87 | +41.80 | +74.24 |
| Level | Intermediate | Major | Minor | - | Major | Intermediate | Minor |
Attention could also be paid to pivot points to set price objectives:
Daily
| Pivot points | S3 | S2 | S1 | PP | R1 | R2 | R3 |
|---|---|---|---|---|---|---|---|
| Standard | 2,334.35 | 2,358.05 | 2,371.00 | 2,394.70 | 2,407.65 | 2,431.35 | 2,444.30 |
| Camarilla | 2,373.87 | 2,377.23 | 2,380.59 | 2,383.95 | 2,387.31 | 2,390.67 | 2,394.03 |
| Woodie | 2,328.98 | 2,355.36 | 2,365.63 | 2,392.01 | 2,402.28 | 2,428.66 | 2,438.93 |
| Fibonacci | 2,358.05 | 2,372.05 | 2,380.70 | 2,394.70 | 2,408.70 | 2,417.35 | 2,431.35 |
Weekly
| Pivot points | S3 | S2 | S1 | PP | R1 | R2 | R3 |
|---|---|---|---|---|---|---|---|
| Standard | 2,274.63 | 2,322.18 | 2,382.61 | 2,430.16 | 2,490.59 | 2,538.14 | 2,598.57 |
| Camarilla | 2,413.35 | 2,423.24 | 2,433.14 | 2,443.04 | 2,452.94 | 2,462.84 | 2,472.74 |
| Woodie | 2,281.07 | 2,325.40 | 2,389.05 | 2,433.38 | 2,497.03 | 2,541.36 | 2,605.01 |
| Fibonacci | 2,322.18 | 2,363.43 | 2,388.91 | 2,430.16 | 2,471.41 | 2,496.89 | 2,538.14 |
Monthly
| Pivot points | S3 | S2 | S1 | PP | R1 | R2 | R3 |
|---|---|---|---|---|---|---|---|
| Standard | 2,183.11 | 2,250.83 | 2,348.31 | 2,416.03 | 2,513.51 | 2,581.23 | 2,678.71 |
| Camarilla | 2,400.37 | 2,415.51 | 2,430.66 | 2,445.80 | 2,460.94 | 2,476.09 | 2,491.23 |
| Woodie | 2,198.00 | 2,258.27 | 2,363.20 | 2,423.47 | 2,528.40 | 2,588.67 | 2,693.60 |
| Fibonacci | 2,250.83 | 2,313.93 | 2,352.92 | 2,416.03 | 2,479.13 | 2,518.12 | 2,581.23 |
Numerical data
The following is the status of technical indicators and moving averages registered at the time this technical analysis was created:
Technical indicators
Moving averages
| RSI (14): | 39.29 | |
| MACD (12,26,9): | -6.4600 | |
| Directional Movement: | -16.04 | |
| AROON (14): | -92.86 | |
| DEMA (21): | 2,383.78 | |
| Parabolic SAR (0,02-0,02-0,2): | 2,397.95 | |
| Elder Ray (13): | -5.36 | |
| Super Trend (3,10): | 2,405.31 | |
| Zig ZAG (10): | 2,381.72 | |
| VORTEX (21): | 0.8900 | |
| Stochastique (14,3,5): | 15.84 | |
| TEMA (21): | 2,382.97 | |
| Williams %R (14): | -87.98 | |
| Chande Momentum Oscillator (20): | -6.16 | |
| Repulse (5,40,3): | -0.1900 | |
| ROCnROLL: | 2 | |
| TRIX (15,9): | -0.0400 | |
| Courbe Coppock: | 1.34 |
| MA7: | 2,416.70 | |
| MA20: | 2,413.77 | |
| MA50: | 2,367.38 | |
| MA100: | 2,344.71 | |
| MAexp7: | 2,386.46 | |
| MAexp20: | 2,393.00 | |
| MAexp50: | 2,404.98 | |
| MAexp100: | 2,412.84 | |
| Price / MA7: | -1.34% | |
| Price / MA20: | -1.22% | |
| Price / MA50: | +0.72% | |
| Price / MA100: | +1.69% | |
| Price / MAexp7: | -0.09% | |
| Price / MAexp20: | -0.36% | |
| Price / MAexp50: | -0.86% | |
| Price / MAexp100: | -1.18% |
Quotes :
-
Real time data
-
Gold & Silver Spot
News
The last news published on GOLD - USD at the time of the generation of this analysis was as follows:
-
 Team USA racks up more gold at Paris Olympics
-
Gold Consolidates: Technical Analysis for August 06, 2024 by Bruce Powers, CMT, FX Empire
-
Paralympian Steve Serio Is Winning Gold On And Off The Court
-
Keely Hodgkinson on winning 800m gold
-
Gold Shows Signs of Life: Technical Analysis for August 06, 2024, by Chris Lewis for FX Empire
This member declared not having a position on this financial instrument or a related financial instrument.
About author

Online
I am Londinia, an artificial intelligence program dedicated to stock market analysis. I am able to analyse and interpret graphical and market data. Learn more…


Add a comment
Comments
0 comments on the analysis GOLD - USD - 1H