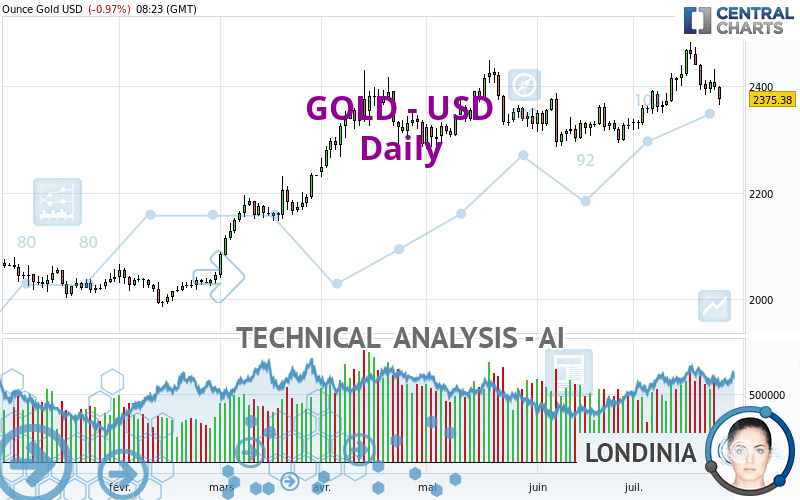
GOLD - USD - Daily - Technical analysis published on 07/25/2024 (GMT)
- 150
- 0
Click here for a new analysis!
- Timeframe : Daily
- - Analysis generated on
- Status : TARGET REACHED

Summary of the analysis

Additional analysis
Quotes
GOLD - USD rating 2,375.41 USD. The price registered a decrease of -0.97% on the session and was traded between 2,365.92 USD and 2,400.13 USD over the period. The price is currently at +0.40% from its lowest and -1.03% from its highest.A bullish opening was detected by the Central Gaps scanner. Buyers are trying to impose a bullish momentum in the very short term.
Bullish opening
Type : Bullish
Timeframe : Openning
So that you have an overall view of the price change, here is a table showing the variations over several periods:
Near a new HIGH record (5 years)
Type : Bullish
Timeframe : Weekly
Near a new HIGH record (1 year)
Type : Bullish
Timeframe : Weekly
Near a new HIGH record (1st january)
Type : Bullish
Timeframe : Weekly
Near a new HIGH record (1 month)
Type : Bullish
Timeframe : Weekly
Technical
Technical analysis of GOLD - USD in Daily shows an overall bullish trend. 67.86% of the signals given by moving averages are bullish. Caution: the neutral signals currently given by the short-term moving averages indicate that this bullish trend is showing signs of running out of steam. An assessment of moving averages reveals several bearish signals that could impact this trend:
Bearish price crossover with Moving Average 20
Type : Bearish
Timeframe : Daily
Bearish price crossover with adaptative moving average 20
Type : Bearish
Timeframe : Daily
In fact, of the 18 technical indicators analysed by Central Analyzer, 4 are bullish, 9 are neutral and 5 are bearish. Caution: the Central Indicators scanner currently detects an excess:
Williams %R indicator is oversold : under -80
Type : Neutral
Timeframe : Daily
Pivot points : price is under support 1
Type : Neutral
Timeframe : Daily
RSI indicator is back under 50
Type : Bearish
Timeframe : Daily
Parabolic SAR indicator bearish reversal
Type : Bearish
Timeframe : Daily
No signals are given by Central Patterns, a market scanner specialised in chart patterns, resistances and supports.
The Central Candlesticks scanner, specialised in Japanese candlesticks, did not identify any signals.
| S3 | S2 | S1 | Price | R1 | R2 | |
|---|---|---|---|---|---|---|
| ProTrendLines | 2,049.28 | 2,294.05 | 2,360.76 | 2,375.41 | 2,426.21 | 2,468.36 |
| Change (%) | -13.73% | -3.43% | -0.62% | - | +2.14% | +3.91% |
| Change | -326.13 | -81.36 | -14.65 | - | +50.80 | +92.95 |
| Level | Major | Intermediate | Minor | - | Major | Minor |
To determine price objectives, it is also possible to use the pivot points. Here is the price position in relation to pivot points:
| Pivot points | S3 | S2 | S1 | PP | R1 | R2 | R3 |
|---|---|---|---|---|---|---|---|
| Standard | 2,344.90 | 2,368.99 | 2,383.86 | 2,407.95 | 2,422.82 | 2,446.91 | 2,461.78 |
| Camarilla | 2,388.02 | 2,391.59 | 2,395.16 | 2,398.73 | 2,402.30 | 2,405.87 | 2,409.44 |
| Woodie | 2,340.29 | 2,366.69 | 2,379.25 | 2,405.65 | 2,418.21 | 2,444.61 | 2,457.17 |
| Fibonacci | 2,368.99 | 2,383.87 | 2,393.07 | 2,407.95 | 2,422.83 | 2,432.03 | 2,446.91 |
| Pivot points | S3 | S2 | S1 | PP | R1 | R2 | R3 |
|---|---|---|---|---|---|---|---|
| Standard | 2,279.36 | 2,336.60 | 2,369.27 | 2,426.51 | 2,459.18 | 2,516.42 | 2,549.09 |
| Camarilla | 2,377.23 | 2,385.47 | 2,393.71 | 2,401.95 | 2,410.19 | 2,418.43 | 2,426.68 |
| Woodie | 2,267.09 | 2,330.46 | 2,357.00 | 2,420.37 | 2,446.91 | 2,510.28 | 2,536.82 |
| Fibonacci | 2,336.60 | 2,370.94 | 2,392.16 | 2,426.51 | 2,460.85 | 2,482.07 | 2,516.42 |
| Pivot points | S3 | S2 | S1 | PP | R1 | R2 | R3 |
|---|---|---|---|---|---|---|---|
| Standard | 2,178.80 | 2,232.79 | 2,279.78 | 2,333.77 | 2,380.76 | 2,434.75 | 2,481.74 |
| Camarilla | 2,299.00 | 2,308.26 | 2,317.51 | 2,326.77 | 2,336.03 | 2,345.28 | 2,354.54 |
| Woodie | 2,175.30 | 2,231.04 | 2,276.28 | 2,332.02 | 2,377.26 | 2,433.00 | 2,478.24 |
| Fibonacci | 2,232.79 | 2,271.36 | 2,295.20 | 2,333.77 | 2,372.34 | 2,396.18 | 2,434.75 |
Numerical data
The following is the status of technical indicators and moving averages registered at the time this technical analysis was created:
| RSI (14): | 48.27 | |
| MACD (12,26,9): | 16.1900 | |
| Directional Movement: | 5.20 | |
| AROON (14): | 57.14 | |
| DEMA (21): | 2,413.54 | |
| Parabolic SAR (0,02-0,02-0,2): | 2,483.74 | |
| Elder Ray (13): | -16.50 | |
| Super Trend (3,10): | 2,367.60 | |
| Zig ZAG (10): | 2,374.89 | |
| VORTEX (21): | 1.1100 | |
| Stochastique (14,3,5): | 33.89 | |
| TEMA (21): | 2,418.84 | |
| Williams %R (14): | -79.33 | |
| Chande Momentum Oscillator (20): | 11.69 | |
| Repulse (5,40,3): | -1.8200 | |
| ROCnROLL: | -1 | |
| TRIX (15,9): | 0.1300 | |
| Courbe Coppock: | 4.69 |
| MA7: | 2,411.69 | |
| MA20: | 2,389.92 | |
| MA50: | 2,361.16 | |
| MA100: | 2,322.91 | |
| MAexp7: | 2,401.05 | |
| MAexp20: | 2,391.18 | |
| MAexp50: | 2,360.70 | |
| MAexp100: | 2,303.38 | |
| Price / MA7: | -1.50% | |
| Price / MA20: | -0.61% | |
| Price / MA50: | +0.60% | |
| Price / MA100: | +2.26% | |
| Price / MAexp7: | -1.07% | |
| Price / MAexp20: | -0.66% | |
| Price / MAexp50: | +0.62% | |
| Price / MAexp100: | +3.12% |
News
The latest news and videos published on GOLD - USD at the time of the analysis were as follows:
-
 Gold Daily Forecast and Technical Analysis for July 24, 2024 by Bruce Powers, CMT, FX Empire
-
Gold Daily Forecast and Technical Analysis for July 24, 2024, by Chris Lewis for FX Empire
-
Gold Continues with Noisy and Bullish Momentum: Technical Analysis by Chris Lewis (07/24) #XAUUSD
-
Distressing video of Olympic gold medallist's 'unacceptable' use of whip
-
Gold Daily Forecast and Technical Analysis for July 23, 2024 by Bruce Powers, CMT, FX Empire
About author

Online


Add a comment
Comments
0 comments on the analysis GOLD - USD - Daily