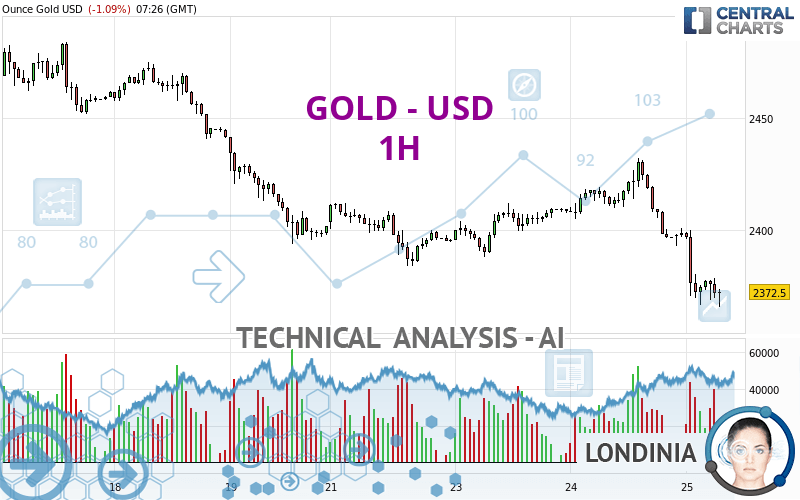
GOLD - USD - 1H - Technical analysis published on 07/25/2024 (GMT)
- 96
- 0
- Who voted?
Click here for a new analysis!
- Timeframe : 1H
- - Analysis generated on
- Status : TARGET REACHED

Summary of the analysis

Additional analysis
Quotes
GOLD - USD rating 2,372.48 USD. The price registered a decrease of -1.09% on the session and was traded between 2,365.92 USD and 2,400.13 USD over the period. The price is currently at +0.28% from its lowest and -1.15% from its highest.The Central Gaps scanner detects a bullish opening. A small advantage for buyers in the very short term.
Bullish opening
Type : Bullish
Timeframe : Openning
Here is a more detailed summary of the historical variations registered by GOLD - USD:
Near a new HIGH record (5 years)
Type : Bullish
Timeframe : Weekly
Near a new HIGH record (1 year)
Type : Bullish
Timeframe : Weekly
Near a new HIGH record (1st january)
Type : Bullish
Timeframe : Weekly
Near a new HIGH record (1 month)
Type : Bullish
Timeframe : Weekly
Technical
A technical analysis in 1H of this GOLD - USD chart shows a sharp bearish trend. The signals given by moving averages are 89.29% bearish. This strong bearish trend is confirmed by the strong signals currently being given by short-term moving averages. The Central Indicators market scanner currently does not detect any result that concerns moving averages.
On the 18 technical indicators analysed, 4 are bullish, 3 are neutral and 11 are bearish. But beware of excesses. The Central Indicators scanner currently detects this:
RSI indicator is oversold : under 30
Type : Neutral
Timeframe : 1 hour
CCI indicator is oversold : under -100
Type : Neutral
Timeframe : 1 hour
Williams %R indicator is oversold : under -80
Type : Neutral
Timeframe : 1 hour
Pivot points : price is under support 1
Type : Neutral
Timeframe : Weekly
Pivot points : price is under support 3
Type : Neutral
Timeframe : 1 hour
The analysis of the price chart with Central Patterns scanners does not return any result.
The presence of a bullish Japanese candlestick pattern detected by Central Candlesticks that could cause a very short term rebound was also detected:
Bullish harami
Type : Bullish
Timeframe : 1 hour
| S3 | S2 | S1 | Price | R1 | R2 | R3 | |
|---|---|---|---|---|---|---|---|
| ProTrendLines | 2,049.28 | 2,294.05 | 2,360.76 | 2,372.48 | 2,383.95 | 2,393.83 | 2,409.88 |
| Change (%) | -13.62% | -3.31% | -0.49% | - | +0.48% | +0.90% | +1.58% |
| Change | -323.20 | -78.43 | -11.72 | - | +11.47 | +21.35 | +37.40 |
| Level | Major | Intermediate | Minor | - | Intermediate | Minor | Intermediate |
Pivot points can also be used to set your price objectives. Here is the price situation in relation to pivot points:
| Pivot points | S3 | S2 | S1 | PP | R1 | R2 | R3 |
|---|---|---|---|---|---|---|---|
| Standard | 2,344.90 | 2,368.99 | 2,383.86 | 2,407.95 | 2,422.82 | 2,446.91 | 2,461.78 |
| Camarilla | 2,388.02 | 2,391.59 | 2,395.16 | 2,398.73 | 2,402.30 | 2,405.87 | 2,409.44 |
| Woodie | 2,340.29 | 2,366.69 | 2,379.25 | 2,405.65 | 2,418.21 | 2,444.61 | 2,457.17 |
| Fibonacci | 2,368.99 | 2,383.87 | 2,393.07 | 2,407.95 | 2,422.83 | 2,432.03 | 2,446.91 |
| Pivot points | S3 | S2 | S1 | PP | R1 | R2 | R3 |
|---|---|---|---|---|---|---|---|
| Standard | 2,279.36 | 2,336.60 | 2,369.27 | 2,426.51 | 2,459.18 | 2,516.42 | 2,549.09 |
| Camarilla | 2,377.23 | 2,385.47 | 2,393.71 | 2,401.95 | 2,410.19 | 2,418.43 | 2,426.68 |
| Woodie | 2,267.09 | 2,330.46 | 2,357.00 | 2,420.37 | 2,446.91 | 2,510.28 | 2,536.82 |
| Fibonacci | 2,336.60 | 2,370.94 | 2,392.16 | 2,426.51 | 2,460.85 | 2,482.07 | 2,516.42 |
| Pivot points | S3 | S2 | S1 | PP | R1 | R2 | R3 |
|---|---|---|---|---|---|---|---|
| Standard | 2,178.80 | 2,232.79 | 2,279.78 | 2,333.77 | 2,380.76 | 2,434.75 | 2,481.74 |
| Camarilla | 2,299.00 | 2,308.26 | 2,317.51 | 2,326.77 | 2,336.03 | 2,345.28 | 2,354.54 |
| Woodie | 2,175.30 | 2,231.04 | 2,276.28 | 2,332.02 | 2,377.26 | 2,433.00 | 2,478.24 |
| Fibonacci | 2,232.79 | 2,271.36 | 2,295.20 | 2,333.77 | 2,372.34 | 2,396.18 | 2,434.75 |
Numerical data
The following is the status of technical indicators and moving averages registered at the time this technical analysis was created:
| RSI (14): | 25.53 | |
| MACD (12,26,9): | -10.2700 | |
| Directional Movement: | -28.84 | |
| AROON (14): | -100.00 | |
| DEMA (21): | 2,379.03 | |
| Parabolic SAR (0,02-0,02-0,2): | 2,385.55 | |
| Elder Ray (13): | -15.34 | |
| Super Trend (3,10): | 2,393.65 | |
| Zig ZAG (10): | 2,372.47 | |
| VORTEX (21): | 0.7400 | |
| Stochastique (14,3,5): | 14.24 | |
| TEMA (21): | 2,370.77 | |
| Williams %R (14): | -83.22 | |
| Chande Momentum Oscillator (20): | -25.08 | |
| Repulse (5,40,3): | 0.0900 | |
| ROCnROLL: | 2 | |
| TRIX (15,9): | -0.0400 | |
| Courbe Coppock: | 3.12 |
| MA7: | 2,411.61 | |
| MA20: | 2,389.77 | |
| MA50: | 2,361.10 | |
| MA100: | 2,322.89 | |
| MAexp7: | 2,377.93 | |
| MAexp20: | 2,390.68 | |
| MAexp50: | 2,400.41 | |
| MAexp100: | 2,407.49 | |
| Price / MA7: | -1.62% | |
| Price / MA20: | -0.72% | |
| Price / MA50: | +0.48% | |
| Price / MA100: | +2.13% | |
| Price / MAexp7: | -0.23% | |
| Price / MAexp20: | -0.76% | |
| Price / MAexp50: | -1.16% | |
| Price / MAexp100: | -1.45% |
News
Don't forget to follow the news on GOLD - USD. At the time of publication of this analysis, the latest news was as follows:
-
 Gold Daily Forecast and Technical Analysis for July 24, 2024 by Bruce Powers, CMT, FX Empire
-
Gold Daily Forecast and Technical Analysis for July 24, 2024, by Chris Lewis for FX Empire
-
Gold Continues with Noisy and Bullish Momentum: Technical Analysis by Chris Lewis (07/24) #XAUUSD
-
Distressing video of Olympic gold medallist's 'unacceptable' use of whip
-
Gold Daily Forecast and Technical Analysis for July 23, 2024 by Bruce Powers, CMT, FX Empire
About author

Online


Add a comment
Comments
0 comments on the analysis GOLD - USD - 1H