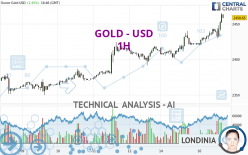
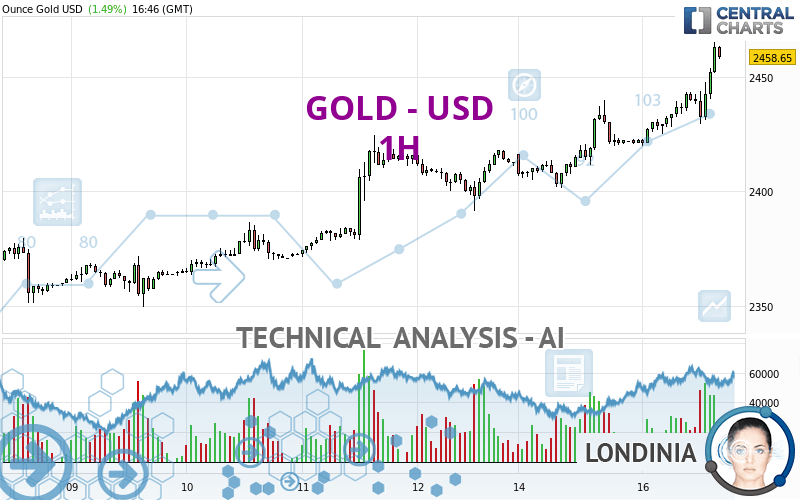
GOLD - USD - 1H - Technical analysis published on 07/16/2024 (GMT)
- 115
- 0
Click here for a new analysis!
- Timeframe : 1H
- - Analysis generated on
- Status : TARGET REACHED
Summary of the analysis

Additional analysis
Quotes
GOLD - USD rating 2,458.61 USD. On the day, this instrument gained +1.49% and was traded between 2,419.99 USD and 2,465.33 USD over the period. The price is currently at +1.60% from its lowest and -0.27% from its highest.The Central Gaps scanner detects a bullish opening. A small advantage for buyers in the very short term.
Bullish opening
Type : Bullish
Timeframe : Openning
So that you have an overall view of the price change, here is a table showing the variations over several periods:
New HIGH record (5 years)
Type : Bullish
Timeframe : Weekly
New HIGH record (1 year)
Type : Bullish
Timeframe : Weekly
New HIGH record (1st january)
Type : Bullish
Timeframe : Weekly
New HIGH record (1 month)
Type : Bullish
Timeframe : Weekly
Technical
A technical analysis in 1H of this GOLD - USD chart shows a strongly bullish trend. 92.86% of the signals given by moving averages are bullish. The overall trend is supported by the strong bullish signals from short-term moving averages. The Central Indicators scanner does not detect any result on moving averages that would impact this trend.
In fact, according to the parameters integrated into the Central Analyzer system, 16 technical indicators out of 18 analysed are currently bullish. Caution: the Central Indicators scanner currently detects an excess:
RSI indicator is overbought : over 70
Type : Neutral
Timeframe : 1 hour
CCI indicator is overbought : over 100
Type : Neutral
Timeframe : 1 hour
Previous candle closed over Bollinger bands
Type : Neutral
Timeframe : 1 hour
RSI indicator: bearish divergence
Type : Bearish
Timeframe : 1 hour
Williams %R indicator is overbought : over -20
Type : Neutral
Timeframe : 1 hour
Pivot points : price is over resistance 1
Type : Neutral
Timeframe : 1 hour
Pivot points : price is over resistance 1
Type : Neutral
Timeframe : Weekly
Central Patterns, the scanner specializing in chart patterns, did not identify any signals.
The Central Candlesticks scanner, specialised in Japanese candlesticks, did not identify any signals.
| S3 | S2 | S1 | Price | |
|---|---|---|---|---|
| ProTrendLines | 2,401.36 | 2,426.21 | 2,439.81 | 2,458.61 |
| Change (%) | -2.33% | -1.32% | -0.76% | - |
| Change | -57.25 | -32.40 | -18.80 | - |
| Level | Minor | Major | Intermediate | - |
To determine price objectives, it is also possible to use the pivot points. Here is the price position in relation to pivot points:
| Pivot points | S3 | S2 | S1 | PP | R1 | R2 | R3 |
|---|---|---|---|---|---|---|---|
| Standard | 2,364.25 | 2,382.81 | 2,402.70 | 2,421.26 | 2,441.15 | 2,459.71 | 2,479.60 |
| Camarilla | 2,412.03 | 2,415.55 | 2,419.08 | 2,422.60 | 2,426.13 | 2,429.65 | 2,433.17 |
| Woodie | 2,364.93 | 2,383.14 | 2,403.38 | 2,421.59 | 2,441.83 | 2,460.04 | 2,480.28 |
| Fibonacci | 2,382.81 | 2,397.50 | 2,406.57 | 2,421.26 | 2,435.95 | 2,445.02 | 2,459.71 |
| Pivot points | S3 | S2 | S1 | PP | R1 | R2 | R3 |
|---|---|---|---|---|---|---|---|
| Standard | 2,291.36 | 2,320.43 | 2,366.44 | 2,395.51 | 2,441.52 | 2,470.59 | 2,516.60 |
| Camarilla | 2,391.79 | 2,398.68 | 2,405.56 | 2,412.44 | 2,419.32 | 2,426.21 | 2,433.09 |
| Woodie | 2,299.82 | 2,324.67 | 2,374.90 | 2,399.75 | 2,449.98 | 2,474.83 | 2,525.06 |
| Fibonacci | 2,320.43 | 2,349.11 | 2,366.83 | 2,395.51 | 2,424.19 | 2,441.91 | 2,470.59 |
| Pivot points | S3 | S2 | S1 | PP | R1 | R2 | R3 |
|---|---|---|---|---|---|---|---|
| Standard | 2,178.80 | 2,232.79 | 2,279.78 | 2,333.77 | 2,380.76 | 2,434.75 | 2,481.74 |
| Camarilla | 2,299.00 | 2,308.26 | 2,317.51 | 2,326.77 | 2,336.03 | 2,345.28 | 2,354.54 |
| Woodie | 2,175.30 | 2,231.04 | 2,276.28 | 2,332.02 | 2,377.26 | 2,433.00 | 2,478.24 |
| Fibonacci | 2,232.79 | 2,271.36 | 2,295.20 | 2,333.77 | 2,372.34 | 2,396.18 | 2,434.75 |
Numerical data
The following is the status of the technical indicators and moving averages at the time of publication of this technical analysis:
| RSI (14): | 75.65 | |
| MACD (12,26,9): | 9.4100 | |
| Directional Movement: | 21.34 | |
| AROON (14): | 78.57 | |
| DEMA (21): | 2,449.66 | |
| Parabolic SAR (0,02-0,02-0,2): | 2,433.58 | |
| Elder Ray (13): | 17.27 | |
| Super Trend (3,10): | 2,436.63 | |
| Zig ZAG (10): | 2,458.43 | |
| VORTEX (21): | 1.2900 | |
| Stochastique (14,3,5): | 90.77 | |
| TEMA (21): | 2,453.85 | |
| Williams %R (14): | -15.42 | |
| Chande Momentum Oscillator (20): | 30.69 | |
| Repulse (5,40,3): | 0.4600 | |
| ROCnROLL: | 1 | |
| TRIX (15,9): | 0.0400 | |
| Courbe Coppock: | 1.87 |
| MA7: | 2,401.50 | |
| MA20: | 2,359.84 | |
| MA50: | 2,352.97 | |
| MA100: | 2,299.82 | |
| MAexp7: | 2,450.06 | |
| MAexp20: | 2,438.64 | |
| MAexp50: | 2,425.76 | |
| MAexp100: | 2,411.39 | |
| Price / MA7: | +2.38% | |
| Price / MA20: | +4.19% | |
| Price / MA50: | +4.49% | |
| Price / MA100: | +6.90% | |
| Price / MAexp7: | +0.35% | |
| Price / MAexp20: | +0.82% | |
| Price / MAexp50: | +1.35% | |
| Price / MAexp100: | +1.96% |
News
Don't forget to follow the news on GOLD - USD. At the time of publication of this analysis, the latest news was as follows:
-
 Gold Daily Forecast and Technical Analysis for July 16, by Chris Lewis, #XAUUSD, #FXEmpire #gold
-
Gold Daily Forecast and Technical Analysis for July 16, 2024, by Chris Lewis for FX Empire
-
Gold Forecast, July 15, 2024, by Chris Lewis for FX Empire #trading #gold #xauusd
-
Weekly Technical Outlook: 15/07/2024 - Gold, EURUSD, GBPUSD
-
Gold Daily Forecast and Technical Analysis for July 15, 2024, by Chris Lewis for FX Empire
About author

Online


Add a comment
Comments
0 comments on the analysis GOLD - USD - 1H