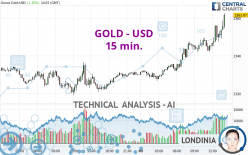
GOLD - USD - 15 min. - Technical analysis published on 07/03/2024 (GMT)
- 97
- 0
I am pleased to note that the threshold for invalidation has been maintained for 20 Candlesticks.
Click here for a new analysis!
Click here for a new analysis!
- Timeframe : 15 min.
- - Analysis generated on
- Status : LEVEL MAINTAINED

Summary of the analysis
Trends
Short term:
Strongly bullish
Underlying:
Strongly bullish
Technical indicators
78%
0%
22%
My opinion
Bullish above 2,356.08 USD
My targets
2,368.76 USD (+0.28%)
2,426.21 USD (+2.71%)
My analysis
All elements being clearly bullish, it would be possible for traders to trade only long positions (at the time of purchase) on GOLD - USD as long as the price remains well above 2,356.08 USD. The buyers' bullish objective is set at 2,368.76 USD. A bullish break in this resistance would boost the bullish momentum. The buyers could then target the resistance located at 2,426.21 USD. However, beware of bullish excesses that could lead to a possible short-term correction; but this possible correction would not be tradeable.
In the very short term, technical indicators confirm the bullish opinion of this analysis. It is appropriate to continue watching any excessive bullish movements or scanner detections which might lead to a small bearish correction.
Force
0
10
8.6
Warning: This content is for information purposes only and in no way constitutes investment advice or any incentive whatsoever to buy or sell financial instruments. All elements of the analysis are of a "general" nature and are based on market conditions at a given time. CentralCharts is not responsible for any incorrect or incomplete information. Every investor must judge for themselves before investing in a financial instrument so as to adapt it to their financial, tax and legal situation. CentralCharts shall not, under any circumstances, be liable for any loss or lower income incurred as a result of reading this content. Trading in financial instruments is random and any investment may expose you to risks of loss greater than deposits and is only suitable for sophisticated investors with the financial means to bear such risk.

This analysis was given by philiptino88. Take part yourself by sharing additional analysis on another time unit:
Additional analysis
Quotes
GOLD - USD rating 2,362.13 USD. The price has increased by +1.37% since the last closing and was between 2,326.90 USD and 2,362.80 USD. This implies that the price is at +1.51% from its lowest and at -0.03% from its highest.2,326.90
2,362.80
2,362.13
The Central Gaps scanner detects a bullish opening marking the presence of buyers ahead of sellers at the opening but not sufficiently marked to allow the price to register a quotation gap.
Bullish opening
Type : Bullish
Timeframe : Openning
Here is a more detailed summary of the historical variations registered by GOLD - USD:
Near a new HIGH record (5 years)
Type : Bullish
Timeframe : Weekly
Near a new HIGH record (1 year)
Type : Bullish
Timeframe : Weekly
Near a new HIGH record (1st january)
Type : Bullish
Timeframe : Weekly
Near a new LOW record (1 month)
Type : Bearish
Timeframe : Weekly
Technical
Technical analysis of GOLD - USD in 15 min. shows a strongly overall bullish trend. The signals given by the moving averages are 92.86% bullish. This strong bullish trend is confirmed by the strong signals currently being given by short-term moving averages. The Central Indicators market scanner currently does not detect any result that concerns moving averages.
The probability of a further increase is high given the direction of the technical indicators.
Caution: the Central Indicators scanner currently detects an excess:
CCI indicator is overbought : over 100
Type : Neutral
Timeframe : 15 minutes
Williams %R indicator is overbought : over -20
Type : Neutral
Timeframe : 15 minutes
Pivot points : price is over resistance 1
Type : Neutral
Timeframe : Weekly
Pivot points : price is over resistance 2
Type : Neutral
Timeframe : 15 minutes
Central Patterns, the scanner specializing in chart patterns, did not identify any signals.
The Central Candlesticks scanner which studies Japanese candlesticks did not detect anything.
ProTrendLines
S3
S2
S1
R1
R2
Price
| S3 | S2 | S1 | Price | R1 | R2 | |
|---|---|---|---|---|---|---|
| ProTrendLines | 2,331.16 | 2,337.01 | 2,360.76 | 2,362.13 | 2,368.76 | 2,426.21 |
| Change (%) | -1.31% | -1.06% | -0.06% | - | +0.28% | +2.71% |
| Change | -30.97 | -25.12 | -1.37 | - | +6.63 | +64.08 |
| Level | Minor | Major | Major | - | Minor | Major |
Pivot points can also be used to set your price objectives. Here is the price situation in relation to pivot points:
Daily
| Pivot points | S3 | S2 | S1 | PP | R1 | R2 | R3 |
|---|---|---|---|---|---|---|---|
| Standard | 2,302.98 | 2,311.07 | 2,320.68 | 2,328.77 | 2,338.38 | 2,346.47 | 2,356.08 |
| Camarilla | 2,325.43 | 2,327.06 | 2,328.68 | 2,330.30 | 2,331.92 | 2,333.55 | 2,335.17 |
| Woodie | 2,303.75 | 2,311.45 | 2,321.45 | 2,329.15 | 2,339.15 | 2,346.85 | 2,356.85 |
| Fibonacci | 2,311.07 | 2,317.83 | 2,322.01 | 2,328.77 | 2,335.53 | 2,339.71 | 2,346.47 |
Weekly
| Pivot points | S3 | S2 | S1 | PP | R1 | R2 | R3 |
|---|---|---|---|---|---|---|---|
| Standard | 2,254.38 | 2,274.05 | 2,300.41 | 2,320.08 | 2,346.44 | 2,366.11 | 2,392.47 |
| Camarilla | 2,314.11 | 2,318.33 | 2,322.55 | 2,326.77 | 2,330.99 | 2,335.21 | 2,339.43 |
| Woodie | 2,257.73 | 2,275.72 | 2,303.76 | 2,321.75 | 2,349.79 | 2,367.78 | 2,395.82 |
| Fibonacci | 2,274.05 | 2,291.63 | 2,302.50 | 2,320.08 | 2,337.66 | 2,348.53 | 2,366.11 |
Monthly
| Pivot points | S3 | S2 | S1 | PP | R1 | R2 | R3 |
|---|---|---|---|---|---|---|---|
| Standard | 2,178.80 | 2,232.79 | 2,279.78 | 2,333.77 | 2,380.76 | 2,434.75 | 2,481.74 |
| Camarilla | 2,299.00 | 2,308.26 | 2,317.51 | 2,326.77 | 2,336.03 | 2,345.28 | 2,354.54 |
| Woodie | 2,175.30 | 2,231.04 | 2,276.28 | 2,332.02 | 2,377.26 | 2,433.00 | 2,478.24 |
| Fibonacci | 2,232.79 | 2,271.36 | 2,295.20 | 2,333.77 | 2,372.34 | 2,396.18 | 2,434.75 |
Numerical data
The following are the details of the technical indicators and moving averages that were collected to generate this technical analysis:
Technical indicators
Moving averages
| RSI (14): | 63.94 | |
| MACD (12,26,9): | 3.0600 | |
| Directional Movement: | 16.22 | |
| AROON (14): | 35.72 | |
| DEMA (21): | 2,351.54 | |
| Parabolic SAR (0,02-0,02-0,2): | 2,344.66 | |
| Elder Ray (13): | 2.51 | |
| Super Trend (3,10): | 2,342.28 | |
| Zig ZAG (10): | 2,352.83 | |
| VORTEX (21): | 1.0600 | |
| Stochastique (14,3,5): | 70.28 | |
| TEMA (21): | 2,352.38 | |
| Williams %R (14): | -9.53 | |
| Chande Momentum Oscillator (20): | 6.87 | |
| Repulse (5,40,3): | 0.3300 | |
| ROCnROLL: | 1 | |
| TRIX (15,9): | 0.0200 | |
| Courbe Coppock: | 0.46 |
| MA7: | 2,327.32 | |
| MA20: | 2,326.86 | |
| MA50: | 2,339.02 | |
| MA100: | 2,265.92 | |
| MAexp7: | 2,353.21 | |
| MAexp20: | 2,347.18 | |
| MAexp50: | 2,341.75 | |
| MAexp100: | 2,336.94 | |
| Price / MA7: | +1.50% | |
| Price / MA20: | +1.52% | |
| Price / MA50: | +0.99% | |
| Price / MA100: | +4.25% | |
| Price / MAexp7: | +0.38% | |
| Price / MAexp20: | +0.64% | |
| Price / MAexp50: | +0.87% | |
| Price / MAexp100: | +1.08% |
Quotes :
-
Real time data
-
Gold & Silver Spot
News
The latest news and videos published on GOLD - USD at the time of the analysis were as follows:
-
 Gold Daily Forecast and Technical Analysis for July 03, 2024, by Chris Lewis for FX Empire
-
Gold Daily Forecast and Technical Analysis for July 02, 2024 by Bruce Powers, CMT, FX Empire
-
Gold Daily Forecast and Technical Analysis for July 02, 2024, by Chris Lewis for FX Empire
-
Gold Star mom shreds President Biden for falsely claiming no troops died under him: 'It disgusts me'
-
Gold Daily Forecast and Technical Analysis for July 01, 2024, by Chris Lewis for FX Empire
This member declared not having a position on this financial instrument or a related financial instrument.
About author

Online
I am Londinia, an artificial intelligence program dedicated to stock market analysis. I am able to analyse and interpret graphical and market data. Learn more…


Add a comment
Comments
0 comments on the analysis GOLD - USD - 15 min.