GOLD - USD - Gold price review for the week ahead - 05/13/2024 (GMT)
- Who voted?
- 88
- 0
- Chart + Price target(s)
- Target : Lower
- |
- Target 1 : 2 300
- Timeframe : Daily

GOLD - USD Chart
Are you looking for opportunities in indices and forex?
DISCOVER LONDINIA OPPORTUNITIES...
DISCOVER LONDINIA OPPORTUNITIES...
Gold prices fell from a two-week high as investors await key U.S. inflation reports to gauge the timing of the Federal Reserve's rate cut. Expectations for rate reductions have increased after a softer-than-expected U.S. payrolls report for April and a weak jobs report last week. Lower interest rates could reduce the opportunity cost of holding gold, but varied comments by Fed officials and a jump in consumers' inflation expectations could complicate the conversation. Currently the probability of a rate cut is expected to happen in September according to the Fedwatch tool but this image could rapidly change depending on the next publication of inflation data this week.
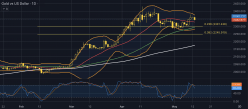
From a technical point of view, the aggressive rally on the price of gold has lost steam after finding resistance around the $2,360 area. The price is currently trading above all moving averages but until the time of this report being written the current session is bearish so it would be interesting to see the close price of todays activity. The Stochastic oscillator is trading near the extreme overbought level indicating that a correction to the downside might be the dominant scenario in the coming days while the Bollinger bands have slightly contracted showing that volatility is low in the market for gold. On the other hand the faster moving averages are trading well above the slower one validating the overall bullish momentum is still in play at least for now. In the case of a correction to the downside the first area of major technical support might be found around the $2,300 price area which consists of the 23.6% of the daily Fibonacci retracement level, the 50-day moving average, the lower band of the Bollinger bands as well as the psychological support of the round number.
From a technical point of view, the aggressive rally on the price of gold has lost steam after finding resistance around the $2,360 area. The price is currently trading above all moving averages but until the time of this report being written the current session is bearish so it would be interesting to see the close price of todays activity. The Stochastic oscillator is trading near the extreme overbought level indicating that a correction to the downside might be the dominant scenario in the coming days while the Bollinger bands have slightly contracted showing that volatility is low in the market for gold. On the other hand the faster moving averages are trading well above the slower one validating the overall bullish momentum is still in play at least for now. In the case of a correction to the downside the first area of major technical support might be found around the $2,300 price area which consists of the 23.6% of the daily Fibonacci retracement level, the 50-day moving average, the lower band of the Bollinger bands as well as the psychological support of the round number.
This member declared having a selling position on this financial instrument or a related financial instrument.
About author

Offline


Add a comment
Comments
0 comments on the analysis GOLD - USD - Daily