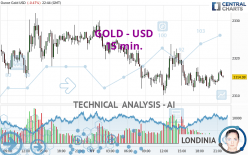
GOLD - USD - 15 min. - Technical analysis published on 05/07/2024 (GMT)
- 115
- 0
Click here for a new analysis!
- Timeframe : 15 min.
- - Analysis generated on
- Status : LEVEL MAINTAINED

Summary of the analysis

Additional analysis
Quotes
GOLD - USD rating 2,314.99 USD. On the day, this instrument lost -0.48% and was traded between 2,311.10 USD and 2,330.00 USD over the period. The price is currently at +0.17% from its lowest and -0.64% from its highest.The Central Gaps scanner detects a bullish opening. A small advantage for buyers in the very short term.
Bullish opening
Type : Bullish
Timeframe : Openning
Here is a more detailed summary of the historical variations registered by GOLD - USD:
Near a new HIGH record (5 years)
Type : Bullish
Timeframe : Weekly
Near a new HIGH record (1 year)
Type : Bullish
Timeframe : Weekly
Near a new HIGH record (1st january)
Type : Bullish
Timeframe : Weekly
Near a new HIGH record (1 month)
Type : Bullish
Timeframe : Weekly
Technical
Technical analysis of GOLD - USD in 15 min. shows an overall bearish trend. The signals given by moving averages are 75.00% bearish. This bearish trend could slow down given the neutral signals currently being given by short-term moving averages. The Central Indicators scanner detects bearish signals on moving averages that could impact this trend:
Bearish price crossover with Moving Average 50
Type : Bearish
Timeframe : 15 minutes
Bearish price crossover with adaptative moving average 20
Type : Bearish
Timeframe : 15 minutes
In fact, according to the parameters integrated into the Central Analyzer system, only 9 technical indicators out of 18 analysed are currently bullish. Caution: the Central Indicators scanner currently detects an excess:
CCI indicator is overbought : over 100
Type : Neutral
Timeframe : 15 minutes
Williams %R indicator is overbought : over -20
Type : Neutral
Timeframe : 15 minutes
Aroon indicator bullish trend
Type : Bullish
Timeframe : 15 minutes
Price is back over the pivot point
Type : Bullish
Timeframe : Weekly
Momentum indicator is back over 0
Type : Bullish
Timeframe : 15 minutes
The analysis of the price chart with Central Patterns scanners does not return any result.
The presence of these bearish patterns in Japanese candlesticks detected by Central Candlesticks that could cause a correction in the very short term were also noted
Bearish harami
Type : Bearish
Timeframe : 15 minutes
Bearish harami cross
Type : Bearish
Timeframe : 15 minutes
| S3 | S2 | S1 | Price | R1 | R2 | R3 | |
|---|---|---|---|---|---|---|---|
| ProTrendLines | 2,281.63 | 2,291.86 | 2,309.29 | 2,314.99 | 2,320.24 | 2,328.49 | 2,336.02 |
| Change (%) | -1.44% | -1.00% | -0.25% | - | +0.23% | +0.58% | +0.91% |
| Change | -33.36 | -23.13 | -5.70 | - | +5.25 | +13.50 | +21.03 |
| Level | Intermediate | Minor | Minor | - | Major | Intermediate | Minor |
Attention could also be paid to pivot points to set price objectives:
| Pivot points | S3 | S2 | S1 | PP | R1 | R2 | R3 |
|---|---|---|---|---|---|---|---|
| Standard | 2,261.09 | 2,276.48 | 2,301.25 | 2,316.64 | 2,341.41 | 2,356.80 | 2,381.57 |
| Camarilla | 2,314.99 | 2,318.67 | 2,322.35 | 2,326.03 | 2,329.71 | 2,333.39 | 2,337.07 |
| Woodie | 2,265.79 | 2,278.83 | 2,305.95 | 2,318.99 | 2,346.11 | 2,359.15 | 2,386.27 |
| Fibonacci | 2,276.48 | 2,291.82 | 2,301.30 | 2,316.64 | 2,331.98 | 2,341.46 | 2,356.80 |
| Pivot points | S3 | S2 | S1 | PP | R1 | R2 | R3 |
|---|---|---|---|---|---|---|---|
| Standard | 2,200.35 | 2,238.85 | 2,269.77 | 2,308.27 | 2,339.19 | 2,377.69 | 2,408.61 |
| Camarilla | 2,281.61 | 2,287.97 | 2,294.34 | 2,300.70 | 2,307.06 | 2,313.43 | 2,319.79 |
| Woodie | 2,196.57 | 2,236.96 | 2,265.99 | 2,306.38 | 2,335.41 | 2,375.80 | 2,404.83 |
| Fibonacci | 2,238.85 | 2,265.37 | 2,281.75 | 2,308.27 | 2,334.79 | 2,351.17 | 2,377.69 |
| Pivot points | S3 | S2 | S1 | PP | R1 | R2 | R3 |
|---|---|---|---|---|---|---|---|
| Standard | 1,999.72 | 2,114.12 | 2,202.75 | 2,317.15 | 2,405.78 | 2,520.18 | 2,608.81 |
| Camarilla | 2,235.55 | 2,254.16 | 2,272.77 | 2,291.38 | 2,309.99 | 2,328.60 | 2,347.21 |
| Woodie | 1,986.84 | 2,107.68 | 2,189.87 | 2,310.71 | 2,392.90 | 2,513.74 | 2,595.93 |
| Fibonacci | 2,114.12 | 2,191.68 | 2,239.59 | 2,317.15 | 2,394.71 | 2,442.62 | 2,520.18 |
Numerical data
The following is the status of technical indicators and moving averages registered at the time this technical analysis was created:
| RSI (14): | 51.33 | |
| MACD (12,26,9): | -0.4700 | |
| Directional Movement: | 0.18 | |
| AROON (14): | -42.86 | |
| DEMA (21): | 2,313.82 | |
| Parabolic SAR (0,02-0,02-0,2): | 2,311.53 | |
| Elder Ray (13): | 0.33 | |
| Super Trend (3,10): | 2,310.53 | |
| Zig ZAG (10): | 2,316.08 | |
| VORTEX (21): | 1.0200 | |
| Stochastique (14,3,5): | 55.15 | |
| TEMA (21): | 2,314.17 | |
| Williams %R (14): | -6.96 | |
| Chande Momentum Oscillator (20): | 1.16 | |
| Repulse (5,40,3): | 0.1200 | |
| ROCnROLL: | -1 | |
| TRIX (15,9): | 0.0000 | |
| Courbe Coppock: | 0.01 |
| MA7: | 2,313.53 | |
| MA20: | 2,339.76 | |
| MA50: | 2,246.69 | |
| MA100: | 2,139.85 | |
| MAexp7: | 2,314.88 | |
| MAexp20: | 2,314.46 | |
| MAexp50: | 2,315.78 | |
| MAexp100: | 2,316.80 | |
| Price / MA7: | +0.06% | |
| Price / MA20: | -1.06% | |
| Price / MA50: | +3.04% | |
| Price / MA100: | +8.18% | |
| Price / MAexp7: | +0.00% | |
| Price / MAexp20: | +0.02% | |
| Price / MAexp50: | -0.03% | |
| Price / MAexp100: | -0.08% |
News
The latest news and videos published on GOLD - USD at the time of the analysis were as follows:
-
 Gold Daily Forecast and Technical Analysis for May 07, 2024 by Bruce Powers, CMT, FX Empire
-
Gold Daily Forecast and Technical Analysis for May 7, by Chris Lewis, #XAUUSD, #FXEmpire #gold
-
Gold Daily Forecast and Technical Analysis for May 07, 2024, by Chris Lewis for FX Empire
-
Gold Daily Forecast and Technical Analysis for May 6, by Chris Lewis, #XAUUSD, #FXEmpire #gold
-
Gold Daily Forecast and Technical Analysis for May 06, 2024, by Chris Lewis for FX Empire
About author

Online


Add a comment
Comments
0 comments on the analysis GOLD - USD - 15 min.