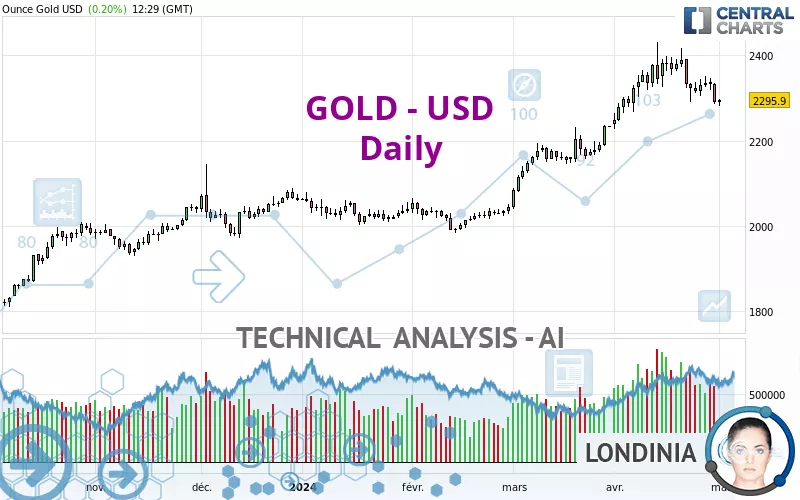
GOLD - USD - Daily - Technical analysis published on 05/01/2024 (GMT)
- 108
- 0
Click here for a new analysis!
- Timeframe : Daily
- - Analysis generated on
- Status : TARGET REACHED
Summary of the analysis

Additional analysis
Quotes
GOLD - USD rating 2,295.89 USD. The price has increased by +0.20% since the last closing with the lowest point at 2,281.63 USD and the highest point at 2,298.75 USD. The deviation from the price is +0.62% for the low point and -0.12% for the high point.A bullish opening was detected by the Central Gaps scanner. Buyers are trying to impose a bullish momentum in the very short term.
Bullish opening
Type : Bullish
Timeframe : Openning
Here is a more detailed summary of the historical variations registered by GOLD - USD:
Near a new HIGH record (5 years)
Type : Bullish
Timeframe : Weekly
Near a new LOW record (1 month)
Type : Bearish
Timeframe : Weekly
Technical
A technical analysis in Daily of this GOLD - USD chart shows a bullish trend. The signals given by moving averages are 71.43% bullish. This bullish trend could slow down given the neutral signals currently being given by short-term moving averages. The Central Indicators scanner detects a bearish signal on moving averages that could impact this trend:
Bearish trend reversal : adaptative moving average 20
Type : Bearish
Timeframe : Daily
In fact, according to the parameters integrated into the Central Analyzer system, only 8 technical indicators out of 18 analysed are currently bearish. Caution: the Central Indicators scanner currently detects an excess:
CCI indicator is oversold : under -100
Type : Neutral
Timeframe : Daily
Williams %R indicator is oversold : under -80
Type : Neutral
Timeframe : Daily
The analysis of the price chart with Central Patterns scanners does not return any result.
Central Candlesticks, the scanner specialised in Japanese candlesticks, detects a bullish signal that could support the hypothesis of a small rebound in the very short term:
Bullish harami
Type : Bullish
Timeframe : Daily
| S3 | S2 | S1 | Price | R1 | |
|---|---|---|---|---|---|
| ProTrendLines | 1,988.41 | 2,049.28 | 2,157.06 | 2,295.89 | 2,390.13 |
| Change (%) | -13.39% | -10.74% | -6.05% | - | +4.10% |
| Change | -307.48 | -246.61 | -138.83 | - | +94.24 |
| Level | Major | Major | Minor | - | Intermediate |
Attention could also be paid to pivot points to set price objectives:
| Pivot points | S3 | S2 | S1 | PP | R1 | R2 | R3 |
|---|---|---|---|---|---|---|---|
| Standard | 2,221.26 | 2,253.22 | 2,272.30 | 2,304.26 | 2,323.34 | 2,355.30 | 2,374.38 |
| Camarilla | 2,277.34 | 2,282.02 | 2,286.70 | 2,291.38 | 2,296.06 | 2,300.74 | 2,305.42 |
| Woodie | 2,214.82 | 2,250.00 | 2,265.86 | 2,301.04 | 2,316.90 | 2,352.08 | 2,367.94 |
| Fibonacci | 2,253.22 | 2,272.72 | 2,284.76 | 2,304.26 | 2,323.76 | 2,335.80 | 2,355.30 |
| Pivot points | S3 | S2 | S1 | PP | R1 | R2 | R3 |
|---|---|---|---|---|---|---|---|
| Standard | 2,187.28 | 2,239.38 | 2,287.70 | 2,339.80 | 2,388.12 | 2,440.22 | 2,488.54 |
| Camarilla | 2,308.41 | 2,317.61 | 2,326.82 | 2,336.02 | 2,345.23 | 2,354.43 | 2,363.64 |
| Woodie | 2,185.39 | 2,238.44 | 2,285.81 | 2,338.86 | 2,386.23 | 2,439.28 | 2,486.65 |
| Fibonacci | 2,239.38 | 2,277.74 | 2,301.44 | 2,339.80 | 2,378.16 | 2,401.86 | 2,440.22 |
| Pivot points | S3 | S2 | S1 | PP | R1 | R2 | R3 |
|---|---|---|---|---|---|---|---|
| Standard | 1,999.72 | 2,114.12 | 2,202.75 | 2,317.15 | 2,405.78 | 2,520.18 | 2,608.81 |
| Camarilla | 2,235.55 | 2,254.16 | 2,272.77 | 2,291.38 | 2,309.99 | 2,328.60 | 2,347.21 |
| Woodie | 1,986.84 | 2,107.68 | 2,189.87 | 2,310.71 | 2,392.90 | 2,513.74 | 2,595.93 |
| Fibonacci | 2,114.12 | 2,191.68 | 2,239.59 | 2,317.15 | 2,394.71 | 2,442.62 | 2,520.18 |
Numerical data
The following are the details of the technical indicators and moving averages that were collected to generate this technical analysis:
| RSI (14): | 49.35 | |
| MACD (12,26,9): | 23.5300 | |
| Directional Movement: | 1.07 | |
| AROON (14): | -92.86 | |
| DEMA (21): | 2,355.44 | |
| Parabolic SAR (0,02-0,02-0,2): | 2,377.33 | |
| Elder Ray (13): | -33.80 | |
| Super Trend (3,10): | 2,265.09 | |
| Zig ZAG (10): | 2,295.68 | |
| VORTEX (21): | 1.0400 | |
| Stochastique (14,3,5): | 14.31 | |
| TEMA (21): | 2,333.76 | |
| Williams %R (14): | -90.33 | |
| Chande Momentum Oscillator (20): | -86.01 | |
| Repulse (5,40,3): | -1.2200 | |
| ROCnROLL: | -1 | |
| TRIX (15,9): | 0.2600 | |
| Courbe Coppock: | 1.93 |
| MA7: | 2,318.08 | |
| MA20: | 2,341.39 | |
| MA50: | 2,223.54 | |
| MA100: | 2,127.44 | |
| MAexp7: | 2,318.36 | |
| MAexp20: | 2,314.53 | |
| MAexp50: | 2,242.32 | |
| MAexp100: | 2,161.29 | |
| Price / MA7: | -0.96% | |
| Price / MA20: | -1.94% | |
| Price / MA50: | +3.25% | |
| Price / MA100: | +7.92% | |
| Price / MAexp7: | -0.97% | |
| Price / MAexp20: | -0.80% | |
| Price / MAexp50: | +2.39% | |
| Price / MAexp100: | +6.23% |
News
The latest news and videos published on GOLD - USD at the time of the analysis were as follows:
-
 Gold Daily Forecast and Technical Analysis for April 30, 2024 by Bruce Powers, CMT, FX Empire
-
Gold Daily Forecast and Technical Analysis for April 30 by Chris Lewis, #XAUUSD, #FXEmpire #gold
-
Avino Silver & Gold Mines – executive interview
-
Gold Forecast May 1, 2024
-
Gold Daily Forecast and Technical Analysis for April 30, 2024, by Chris Lewis for FX Empire
About author

Online


Add a comment
Comments
0 comments on the analysis GOLD - USD - Daily