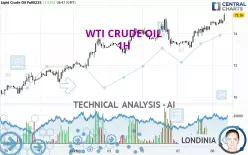
WTI CRUDE OIL - 1H - Technical analysis published on 01/08/2025 (GMT)
- 119
- 0
Click here for a new analysis!
- Timeframe : 1H
- - Analysis generated on
- Status : INVALID

Summary of the analysis

Additional analysis
Quotes
WTI CRUDE OIL rating 75.16 USD. On the day, this instrument gained +1.23% with the lowest point at 74.51 USD and the highest point at 75.28 USD. The deviation from the price is +0.87% for the low point and -0.16% for the high point.The Central Gaps scanner detects a bullish opening marking the presence of buyers ahead of sellers at the opening but not sufficiently marked to allow the price to register a quotation gap.
Bullish opening
Type : Bullish
Timeframe : Openning
A study of price movements over other periods shows the following variations:
Near a new LOW record (1st january)
Type : Bearish
Timeframe : Weekly
Near a new HIGH record (1 month)
Type : Bullish
Timeframe : Weekly
Technical
Technical analysis of WTI CRUDE OIL in 1H shows a strongly overall bullish trend. 92.86% of the signals given by moving averages are bullish. The overall trend is supported by the strong bullish signals from short-term moving averages. There is no crossing of moving average by the price or crossing of moving averages between themselves.
In fact, 17 technical indicators on 18 studied are currently bullish. Caution: the Central Indicators scanner currently detects an excess:
CCI indicator is overbought : over 100
Type : Neutral
Timeframe : 1 hour
Williams %R indicator is overbought : over -20
Type : Neutral
Timeframe : 1 hour
Pivot points : price is over resistance 1
Type : Neutral
Timeframe : 1 hour
Central Patterns, the scanner specializing in chart patterns, did not identify any signals.
The Central Candlesticks scanner currently notes the presence of this pattern in Japanese candlesticks that could mark the end of the short-term trend currently underway:
Doji
Type : Neutral
Timeframe : 1 hour
| S3 | S2 | S1 | Price | R1 | R2 | R3 | |
|---|---|---|---|---|---|---|---|
| ProTrendLines | 73.12 | 74.47 | 74.99 | 75.16 | 76.18 | 78.01 | 79.44 |
| Change (%) | -2.71% | -0.92% | -0.23% | - | +1.36% | +3.79% | +5.69% |
| Change | -2.04 | -0.69 | -0.17 | - | +1.02 | +2.85 | +4.28 |
| Level | Intermediate | Intermediate | Intermediate | - | Intermediate | Minor | Intermediate |
Pivot points can also be used to set your price objectives. Here is the price situation in relation to pivot points:
| Pivot points | S3 | S2 | S1 | PP | R1 | R2 | R3 |
|---|---|---|---|---|---|---|---|
| Standard | 71.98 | 72.54 | 73.40 | 73.96 | 74.82 | 75.38 | 76.24 |
| Camarilla | 73.86 | 73.99 | 74.12 | 74.25 | 74.38 | 74.51 | 74.64 |
| Woodie | 72.12 | 72.62 | 73.54 | 74.04 | 74.96 | 75.46 | 76.38 |
| Fibonacci | 72.54 | 73.09 | 73.42 | 73.96 | 74.51 | 74.84 | 75.38 |
| Pivot points | S3 | S2 | S1 | PP | R1 | R2 | R3 |
|---|---|---|---|---|---|---|---|
| Standard | 67.04 | 68.58 | 71.27 | 72.81 | 75.50 | 77.04 | 79.73 |
| Camarilla | 72.80 | 73.19 | 73.57 | 73.96 | 74.35 | 74.74 | 75.12 |
| Woodie | 67.62 | 68.87 | 71.85 | 73.10 | 76.08 | 77.33 | 80.31 |
| Fibonacci | 68.58 | 70.20 | 71.19 | 72.81 | 74.43 | 75.42 | 77.04 |
| Pivot points | S3 | S2 | S1 | PP | R1 | R2 | R3 |
|---|---|---|---|---|---|---|---|
| Standard | 62.67 | 64.60 | 68.16 | 70.09 | 73.65 | 75.58 | 79.14 |
| Camarilla | 70.21 | 70.71 | 71.22 | 71.72 | 72.22 | 72.73 | 73.23 |
| Woodie | 63.49 | 65.01 | 68.98 | 70.50 | 74.47 | 75.99 | 79.96 |
| Fibonacci | 64.60 | 66.70 | 67.99 | 70.09 | 72.19 | 73.48 | 75.58 |
Numerical data
The following is the status of technical indicators and moving averages registered at the time this technical analysis was created:
| RSI (14): | 70.13 | |
| MACD (12,26,9): | 0.2900 | |
| Directional Movement: | 18.43 | |
| AROON (14): | 100.00 | |
| DEMA (21): | 74.85 | |
| Parabolic SAR (0,02-0,02-0,2): | 74.57 | |
| Elder Ray (13): | 0.38 | |
| Super Trend (3,10): | 74.18 | |
| Zig ZAG (10): | 75.21 | |
| VORTEX (21): | 1.2100 | |
| Stochastique (14,3,5): | 85.56 | |
| TEMA (21): | 74.99 | |
| Williams %R (14): | -7.83 | |
| Chande Momentum Oscillator (20): | 0.75 | |
| Repulse (5,40,3): | 0.7500 | |
| ROCnROLL: | 1 | |
| TRIX (15,9): | 0.0500 | |
| Courbe Coppock: | 1.63 |
| MA7: | 73.25 | |
| MA20: | 71.08 | |
| MA50: | 69.69 | |
| MA100: | 69.83 | |
| MAexp7: | 74.81 | |
| MAexp20: | 74.50 | |
| MAexp50: | 74.08 | |
| MAexp100: | 73.48 | |
| Price / MA7: | +2.61% | |
| Price / MA20: | +5.74% | |
| Price / MA50: | +7.85% | |
| Price / MA100: | +7.63% | |
| Price / MAexp7: | +0.47% | |
| Price / MAexp20: | +0.89% | |
| Price / MAexp50: | +1.46% | |
| Price / MAexp100: | +2.29% |
News
The last news published on WTI CRUDE OIL at the time of the generation of this analysis was as follows:
-
 Yearly Technical Outlook 2025: Gold, WTI crude oil, US 500
-
Technical Analysis on US Dollar index, Gold, WTI
-
WTI Crude Oil Forecast November 21, 2024
-
WTI Crude Oil Forecast November 8, 2024
-
Trade of the week: short WTI crude oil
About author

Online


Add a comment
Comments
0 comments on the analysis WTI CRUDE OIL - 1H