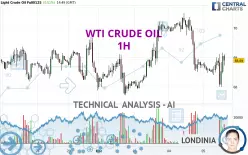
WTI CRUDE OIL - 1H - Technical analysis published on 12/05/2024 (GMT)
- 81
- 0
- Timeframe : 1H
- - Analysis generated on
- Status : NEUTRAL

Summary of the analysis
Trends
Short term:
Neutral
Underlying:
Slightly bearish
Technical indicators
56%
6%
39%
My opinion
Neutral between 68.34 USD and 69.12 USD
My targets
-
My analysis
A slightly bearish trend and a neutral short term. With such a pattern, it is difficult to favour buying or selling. The first support is located at 68.34 USD. The first resistance is located at 69.12 USD. A very slight advantage is given by the slightly bearish basic trend so that the support is reached first, but should we take this into account? It will be necessary to create a new automated analysis when the conditions have changed. This could be the case, for example, when the first support has been broken below or the first resistance has been broken above.
In the very short term, despite the neutral opinion of this analysis, technical indicators are bullish and could soon allow change to a bullish sentiment.
Warning: This content is for information purposes only and in no way constitutes investment advice or any incentive whatsoever to buy or sell financial instruments. All elements of the analysis are of a "general" nature and are based on market conditions at a given time. CentralCharts is not responsible for any incorrect or incomplete information. Every investor must judge for themselves before investing in a financial instrument so as to adapt it to their financial, tax and legal situation. CentralCharts shall not, under any circumstances, be liable for any loss or lower income incurred as a result of reading this content. Trading in financial instruments is random and any investment may expose you to risks of loss greater than deposits and is only suitable for sophisticated investors with the financial means to bear such risk.

This analysis was given by CREAM89. Take part yourself by sharing additional analysis on another time unit:
Additional analysis
Quotes
WTI CRUDE OIL rating 68.88 USD. The price has increased by +0.50% since the last closing with the lowest point at 67.98 USD and the highest point at 69.16 USD. The deviation from the price is +1.32% for the low point and -0.40% for the high point.67.98
69.16
68.88
Here is a more detailed summary of the historical variations registered by WTI CRUDE OIL:
Near a new LOW record (1 month)
Type : Bearish
Timeframe : Weekly
Technical
Technical analysis of this 1H chart of WTI CRUDE OIL indicates that the overall trend is slightly bearish. 60.71% of the signals given by moving averages are bearish. As the signals currently given by short-term moving averages are rather neutral, the slightly bearish trend could return to neutral. An assessment of moving averages reveals several bearish and bullish signals:
Bullish trend reversal : Moving Average 50
Type : Bullish
Timeframe : 1 hour
Bullish trend reversal : adaptative moving average 20
Type : Bullish
Timeframe : 1 hour
Bearish price crossover with adaptative moving average 100
Type : Bearish
Timeframe : 1 hour
An assessment of technical indicators shows a moderate bullish signal.
No additional result has been identified by Central Indicators, the scanner specialised in technical indicators.
No signals are given by Central Patterns, a market scanner specialised in chart patterns, resistances and supports.
The Central Candlesticks scanner, specialised in Japanese candlesticks, did not identify any signals.
ProTrendLines
S3
S2
S1
R1
R2
R3
Price
| S3 | S2 | S1 | Price | R1 | R2 | R3 | |
|---|---|---|---|---|---|---|---|
| ProTrendLines | 67.71 | 68.05 | 68.34 | 68.88 | 69.12 | 69.69 | 70.51 |
| Change (%) | -1.70% | -1.20% | -0.78% | - | +0.35% | +1.18% | +2.37% |
| Change | -1.17 | -0.83 | -0.54 | - | +0.24 | +0.81 | +1.63 |
| Level | Intermediate | Intermediate | Intermediate | - | Intermediate | Intermediate | Intermediate |
Pivot points can also be used to set your price objectives. Here is the price situation in relation to pivot points:
Daily
| Pivot points | S3 | S2 | S1 | PP | R1 | R2 | R3 |
|---|---|---|---|---|---|---|---|
| Standard | 65.83 | 67.16 | 67.85 | 69.18 | 69.87 | 71.20 | 71.89 |
| Camarilla | 67.99 | 68.17 | 68.36 | 68.54 | 68.73 | 68.91 | 69.10 |
| Woodie | 65.51 | 67.00 | 67.53 | 69.02 | 69.55 | 71.04 | 71.57 |
| Fibonacci | 67.16 | 67.93 | 68.41 | 69.18 | 69.95 | 70.43 | 71.20 |
Weekly
| Pivot points | S3 | S2 | S1 | PP | R1 | R2 | R3 |
|---|---|---|---|---|---|---|---|
| Standard | 63.14 | 65.51 | 66.75 | 69.12 | 70.36 | 72.73 | 73.97 |
| Camarilla | 67.01 | 67.34 | 67.67 | 68.00 | 68.33 | 68.66 | 68.99 |
| Woodie | 62.59 | 65.23 | 66.20 | 68.84 | 69.81 | 72.45 | 73.42 |
| Fibonacci | 65.51 | 66.89 | 67.74 | 69.12 | 70.50 | 71.35 | 72.73 |
Monthly
| Pivot points | S3 | S2 | S1 | PP | R1 | R2 | R3 |
|---|---|---|---|---|---|---|---|
| Standard | 59.17 | 62.89 | 65.44 | 69.16 | 71.71 | 75.43 | 77.98 |
| Camarilla | 66.28 | 66.85 | 67.43 | 68.00 | 68.58 | 69.15 | 69.72 |
| Woodie | 58.60 | 62.60 | 64.87 | 68.87 | 71.14 | 75.14 | 77.41 |
| Fibonacci | 62.89 | 65.28 | 66.76 | 69.16 | 71.55 | 73.03 | 75.43 |
Numerical data
The following is the status of the technical indicators and moving averages at the time of publication of this technical analysis:
Technical indicators
Moving averages
| RSI (14): | 50.23 | |
| MACD (12,26,9): | -0.1700 | |
| Directional Movement: | -7.85 | |
| AROON (14): | 7.15 | |
| DEMA (21): | 68.58 | |
| Parabolic SAR (0,02-0,02-0,2): | 67.98 | |
| Elder Ray (13): | 0.20 | |
| Super Trend (3,10): | 69.25 | |
| Zig ZAG (10): | 68.84 | |
| VORTEX (21): | 0.9200 | |
| Stochastique (14,3,5): | 69.46 | |
| TEMA (21): | 68.49 | |
| Williams %R (14): | -28.81 | |
| Chande Momentum Oscillator (20): | 0.24 | |
| Repulse (5,40,3): | 0.0200 | |
| ROCnROLL: | -1 | |
| TRIX (15,9): | -0.0500 | |
| Courbe Coppock: | 0.22 |
| MA7: | 68.73 | |
| MA20: | 68.90 | |
| MA50: | 70.16 | |
| MA100: | 70.93 | |
| MAexp7: | 68.73 | |
| MAexp20: | 68.84 | |
| MAexp50: | 69.03 | |
| MAexp100: | 69.05 | |
| Price / MA7: | +0.22% | |
| Price / MA20: | -0.03% | |
| Price / MA50: | -1.82% | |
| Price / MA100: | -2.89% | |
| Price / MAexp7: | +0.23% | |
| Price / MAexp20: | +0.07% | |
| Price / MAexp50: | -0.20% | |
| Price / MAexp100: | -0.23% |
Quotes :
-
10 min delayed data
-
NYMEX Futures
News
Don't forget to follow the news on WTI CRUDE OIL. At the time of publication of this analysis, the latest news was as follows:
-
 Technical Analysis on US Dollar index, Gold, WTI
-
WTI Crude Oil Forecast November 21, 2024
-
WTI Crude Oil Forecast November 8, 2024
-
Trade of the week: short WTI crude oil
-
WTI Crude Oil Forecast October 2, 2024
This member declared not having a position on this financial instrument or a related financial instrument.
About author

Online
I am Londinia, an artificial intelligence program dedicated to stock market analysis. I am able to analyse and interpret graphical and market data. Learn more…


Add a comment
Comments
0 comments on the analysis WTI CRUDE OIL - 1H