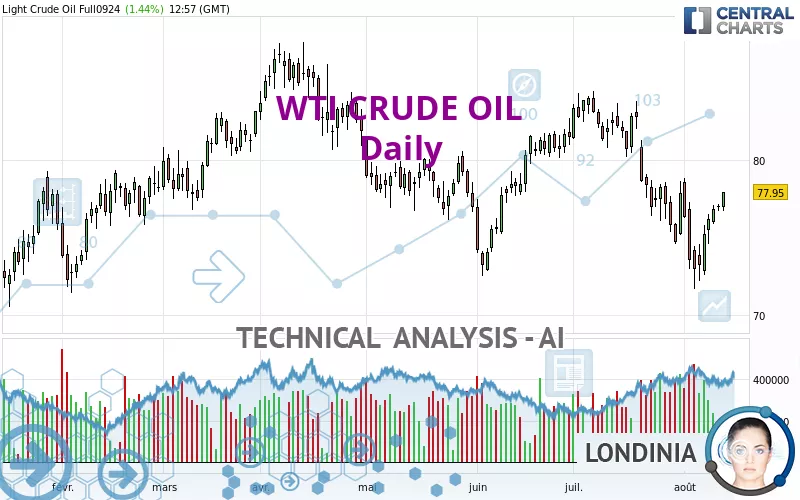
WTI CRUDE OIL - Daily - Technical analysis published on 08/12/2024 (GMT)
- 155
- 0
Click here for a new analysis!
- Timeframe : Daily
- - Analysis generated on
- Status : INVALID
Summary of the analysis

Additional analysis
Quotes
The WTI CRUDE OIL rating is 77.95 USD. The price registered an increase of +1.45% on the session and was between 76.70 USD and 77.98 USD. This implies that the price is at +1.63% from its lowest and at -0.04% from its highest.The Central Gaps scanner detects a bullish opening marking the presence of buyers ahead of sellers at the opening but not sufficiently marked to allow the price to register a quotation gap.
Bullish opening
Type : Bullish
Timeframe : Openning
So that you have an overall view of the price change, here is a table showing the variations over several periods:
Technical
Technical analysis of this Daily chart of WTI CRUDE OIL indicates that the overall trend is bullish. 67.86% of the signals given by moving averages are bullish. This bullish trend shows slight signs of slowing down given the slightly bullish signals given by the short-term moving averages. The Central Indicators scanner detects bullish signals on moving averages that could impact this trend:
Bullish trend reversal : adaptative moving average 20
Type : Bullish
Timeframe : Daily
Bullish price crossover with Moving Average 20
Type : Bullish
Timeframe : Daily
Bullish price crossover with adaptative moving average 50
Type : Bullish
Timeframe : Daily
The technical indicators are bullish. There is still some doubt about the price increase.
But beware of excesses. The Central Indicators scanner currently detects this:
Williams %R indicator is overbought : over -20
Type : Neutral
Timeframe : Daily
Pivot points : price is over resistance 1
Type : Neutral
Timeframe : Daily
RSI indicator is back over 50
Type : Bullish
Timeframe : Daily
MACD crosses UP its Moving Average
Type : Bullish
Timeframe : Daily
Parabolic SAR indicator bullish reversal
Type : Bullish
Timeframe : Daily
The analysis of the price chart with Central Patterns scanners does not return any result.
The Central Candlesticks scanner, specialised in Japanese candlesticks, did not identify any signals.
| S3 | S2 | S1 | Price | R1 | R2 | R3 | |
|---|---|---|---|---|---|---|---|
| ProTrendLines | 65.73 | 73.01 | 75.27 | 77.95 | 78.77 | 81.14 | 82.98 |
| Change (%) | -15.68% | -6.34% | -3.44% | - | +1.05% | +4.09% | +6.45% |
| Change | -12.22 | -4.94 | -2.68 | - | +0.82 | +3.19 | +5.03 |
| Level | Major | Major | Intermediate | - | Major | Minor | Intermediate |
Attention could also be paid to pivot points to set price objectives:
| Pivot points | S3 | S2 | S1 | PP | R1 | R2 | R3 |
|---|---|---|---|---|---|---|---|
| Standard | 74.86 | 75.35 | 76.10 | 76.59 | 77.34 | 77.83 | 78.58 |
| Camarilla | 76.50 | 76.61 | 76.73 | 76.84 | 76.95 | 77.07 | 77.18 |
| Woodie | 74.98 | 75.42 | 76.22 | 76.66 | 77.46 | 77.90 | 78.70 |
| Fibonacci | 75.35 | 75.83 | 76.12 | 76.59 | 77.07 | 77.36 | 77.83 |
| Pivot points | S3 | S2 | S1 | PP | R1 | R2 | R3 |
|---|---|---|---|---|---|---|---|
| Standard | 67.89 | 69.78 | 73.31 | 75.20 | 78.73 | 80.62 | 84.15 |
| Camarilla | 75.35 | 75.85 | 76.34 | 76.84 | 77.34 | 77.83 | 78.33 |
| Woodie | 68.71 | 70.19 | 74.13 | 75.61 | 79.55 | 81.03 | 84.97 |
| Fibonacci | 69.78 | 71.85 | 73.13 | 75.20 | 77.27 | 78.55 | 80.62 |
| Pivot points | S3 | S2 | S1 | PP | R1 | R2 | R3 |
|---|---|---|---|---|---|---|---|
| Standard | 64.59 | 69.59 | 72.95 | 77.95 | 81.31 | 86.31 | 89.67 |
| Camarilla | 74.01 | 74.78 | 75.54 | 76.31 | 77.08 | 77.84 | 78.61 |
| Woodie | 63.77 | 69.18 | 72.13 | 77.54 | 80.49 | 85.90 | 88.85 |
| Fibonacci | 69.59 | 72.78 | 74.76 | 77.95 | 81.14 | 83.12 | 86.31 |
Numerical data
The following is the status of technical indicators and moving averages registered at the time this technical analysis was created:
| RSI (14): | 52.48 | |
| MACD (12,26,9): | -0.8100 | |
| Directional Movement: | -1.28 | |
| AROON (14): | -14.29 | |
| DEMA (21): | 75.74 | |
| Parabolic SAR (0,02-0,02-0,2): | 71.67 | |
| Elder Ray (13): | 0.96 | |
| Super Trend (3,10): | 80.24 | |
| Zig ZAG (10): | 77.85 | |
| VORTEX (21): | 0.9100 | |
| Stochastique (14,3,5): | 72.49 | |
| TEMA (21): | 75.08 | |
| Williams %R (14): | -14.84 | |
| Chande Momentum Oscillator (20): | -0.47 | |
| Repulse (5,40,3): | 3.3400 | |
| ROCnROLL: | 1 | |
| TRIX (15,9): | -0.1800 | |
| Courbe Coppock: | 7.80 |
| MA7: | 75.11 | |
| MA20: | 76.96 | |
| MA50: | 77.89 | |
| MA100: | 78.04 | |
| MAexp7: | 76.18 | |
| MAexp20: | 76.79 | |
| MAexp50: | 77.48 | |
| MAexp100: | 77.17 | |
| Price / MA7: | +3.78% | |
| Price / MA20: | +1.29% | |
| Price / MA50: | +0.08% | |
| Price / MA100: | -0.12% | |
| Price / MAexp7: | +2.32% | |
| Price / MAexp20: | +1.51% | |
| Price / MAexp50: | +0.61% | |
| Price / MAexp100: | +1.01% |
News
The latest news and videos published on WTI CRUDE OIL at the time of the analysis were as follows:
-
 WTI Crude Oil Forecast August 9, 2024
-
WTI Crude Oil Forecast August 8, 2024
-
Technical Analysis: 04/04/2024 - WTI futures surge to a 5-month high
-
Technical Analysis: 28/03/2024 - WTI oil futures in fierce battle with 50.0% Fibo
-
Technical Analysis: 21/03/2024 - WTI crude oil futures slip from 4-month peak
About author

Online


Add a comment
Comments
0 comments on the analysis WTI CRUDE OIL - Daily