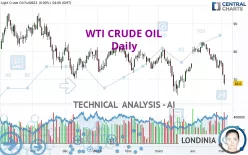
WTI CRUDE OIL - Daily - Technical analysis published on 05/04/2023 (GMT)
- 135
- 0
- Who voted?
Click here for a new analysis!
- Timeframe : Daily
- - Analysis generated on
- Status : INVALID

Summary of the analysis

Additional analysis
Quotes
The WTI CRUDE OIL rating is 68.60 USD. On the day, this instrument gained +0.00% and was traded between 63.64 USD and 69.46 USD over the period. The price is currently at +7.79% from its lowest and -1.24% from its highest.A bearish opening was detected by the Central Gaps scanner. Sellers are trying to impose a bearish trend in the very short term.
Bearish opening
Type : Bearish
Timeframe : Openning
So that you have an overall view of the price change, here is a table showing the variations over several periods:
New LOW record (1 year)
Type : Bearish
Timeframe : Weekly
New LOW record (1st january)
Type : Bearish
Timeframe : Weekly
New LOW record (1 month)
Type : Bearish
Timeframe : Weekly
Technical
Technical analysis of WTI CRUDE OIL in Daily shows a overall strongly bearish trend. 85.71% of the signals given by moving averages are bearish. The overall trend is supported by the strong bearish signals from short-term moving averages. The Central Indicators market scanner currently does not detect any result that concerns moving averages.
In fact, 12 technical indicators on 18 studied are currently bearish. But beware of excesses. The Central Indicators scanner currently detects this:
CCI indicator is oversold : under -100
Type : Neutral
Timeframe : Daily
Previous candle closed under Bollinger bands
Type : Neutral
Timeframe : Daily
Pivot points : price is under support 3
Type : Neutral
Timeframe : Weekly
Central Patterns, the scanner specializing in chart patterns, did not identify any signals.
The Central Candlesticks scanner currently notes the presence of this pattern in Japanese candlesticks that could mark the end of the short-term trend currently underway:
Doji
Type : Neutral
Timeframe : Daily
| S3 | S2 | S1 | Price | R1 | R2 | R3 | |
|---|---|---|---|---|---|---|---|
| ProTrendLines | 39.28 | 58.07 | 66.99 | 68.60 | 73.47 | 77.02 | 82.06 |
| Change (%) | -42.74% | -15.35% | -2.35% | - | +7.10% | +12.27% | +19.62% |
| Change | -29.32 | -10.53 | -1.61 | - | +4.87 | +8.42 | +13.46 |
| Level | Major | Intermediate | Intermediate | - | Major | Intermediate | Major |
Attention could also be paid to pivot points to set price objectives:
| Pivot points | S3 | S2 | S1 | PP | R1 | R2 | R3 |
|---|---|---|---|---|---|---|---|
| Standard | 63.26 | 65.61 | 67.10 | 69.45 | 70.94 | 73.29 | 74.78 |
| Camarilla | 67.54 | 67.90 | 68.25 | 68.60 | 68.95 | 69.30 | 69.66 |
| Woodie | 62.84 | 65.40 | 66.68 | 69.24 | 70.52 | 73.08 | 74.36 |
| Fibonacci | 65.61 | 67.07 | 67.98 | 69.45 | 70.91 | 71.82 | 73.29 |
| Pivot points | S3 | S2 | S1 | PP | R1 | R2 | R3 |
|---|---|---|---|---|---|---|---|
| Standard | 68.83 | 71.38 | 74.08 | 76.63 | 79.33 | 81.88 | 84.58 |
| Camarilla | 75.34 | 75.82 | 76.30 | 76.78 | 77.26 | 77.74 | 78.22 |
| Woodie | 68.91 | 71.42 | 74.16 | 76.67 | 79.41 | 81.92 | 84.66 |
| Fibonacci | 71.38 | 73.39 | 74.63 | 76.63 | 78.64 | 79.88 | 81.88 |
| Pivot points | S3 | S2 | S1 | PP | R1 | R2 | R3 |
|---|---|---|---|---|---|---|---|
| Standard | 62.22 | 68.07 | 71.87 | 77.72 | 81.52 | 87.37 | 91.17 |
| Camarilla | 73.01 | 73.89 | 74.78 | 75.66 | 76.55 | 77.43 | 78.31 |
| Woodie | 61.19 | 67.56 | 70.84 | 77.21 | 80.49 | 86.86 | 90.14 |
| Fibonacci | 68.07 | 71.76 | 74.04 | 77.72 | 81.41 | 83.69 | 87.37 |
Numerical data
The following is the status of the technical indicators and moving averages at the time of publication of this technical analysis:
| RSI (14): | 31.66 | |
| MACD (12,26,9): | -1.5700 | |
| Directional Movement: | -26.63 | |
| AROON (14): | -100.00 | |
| DEMA (21): | 73.96 | |
| Parabolic SAR (0,02-0,02-0,2): | 76.11 | |
| Elder Ray (13): | -7.84 | |
| Super Trend (3,10): | 75.66 | |
| Zig ZAG (10): | 68.53 | |
| VORTEX (21): | 0.6900 | |
| Stochastique (14,3,5): | 10.70 | |
| TEMA (21): | 72.15 | |
| Williams %R (14): | -73.95 | |
| Chande Momentum Oscillator (20): | -12.29 | |
| Repulse (5,40,3): | -2.5200 | |
| ROCnROLL: | 2 | |
| TRIX (15,9): | -0.0100 | |
| Courbe Coppock: | 21.01 |
| MA7: | 72.91 | |
| MA20: | 77.63 | |
| MA50: | 75.84 | |
| MA100: | 77.07 | |
| MAexp7: | 72.39 | |
| MAexp20: | 75.37 | |
| MAexp50: | 76.34 | |
| MAexp100: | 78.10 | |
| Price / MA7: | -5.91% | |
| Price / MA20: | -11.63% | |
| Price / MA50: | -9.55% | |
| Price / MA100: | -10.99% | |
| Price / MAexp7: | -5.24% | |
| Price / MAexp20: | -8.98% | |
| Price / MAexp50: | -10.14% | |
| Price / MAexp100: | -12.16% |
News
The last news published on WTI CRUDE OIL at the time of the generation of this analysis was as follows:
-
 Technical Analysis: 04/05/2023 - WTI oil futures plummet to fresh 17-month low
-
Technical Analysis: 27/04/2023 - WTI crude oil dips further from 200-day SMA
-
Technical Analysis: 21/04/2023 - WTI oil futures on a slippery slope again
-
Technical Analysis: 13/04/2023 - WTI oil futures challenge crucial zone as advance resumes
-
Technical Analysis: 06/04/2023 - WTI oil futures need to breach $83 to brighten outlook
About author

Online


Add a comment
Comments
0 comments on the analysis WTI CRUDE OIL - Daily