WTI CRUDE OIL - Daily - Technical analysis published on 06/24/2022 (GMT)
- 198
- 0
Click here for a new analysis!
- Timeframe : Daily
- - Analysis generated on
- Status : TARGET REACHED

Summary of the analysis

Additional analysis
Quotes
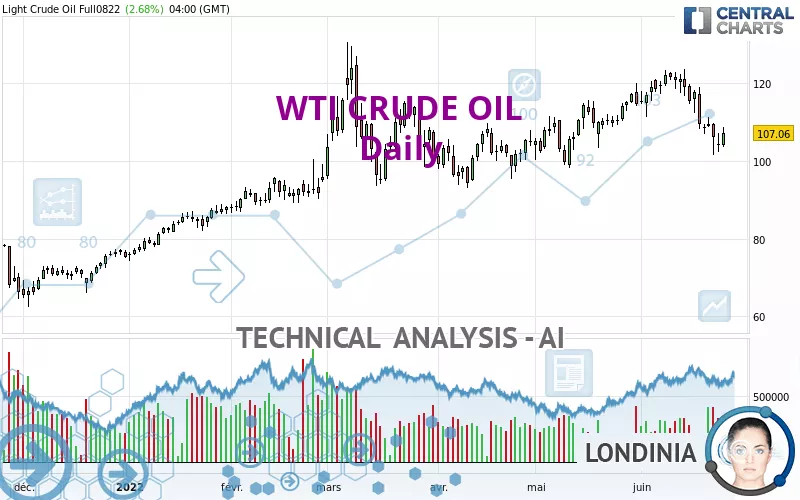
The WTI CRUDE OIL rating is 107.06 USD. On the day, this instrument gained +2.68% and was traded between 103.64 USD and 108.58 USD over the period. The price is currently at +3.30% from its lowest and -1.40% from its highest.The Central Gaps scanner detects a bearish opening. A small advantage for sellers in the very short term.
Bearish opening
Type : Bearish
Timeframe : Openning
A study of price movements over other periods shows the following variations:
Near a new LOW record (1 month)
Type : Bearish
Timeframe : Weekly
Technical
Technical analysis of this Daily chart of WTI CRUDE OIL indicates that the overall trend is slightly bullish. 57.14% of the signals given by moving averages are bullish. Caution: the strong bearish signals currently given by short-term moving averages indicate that a trend reversal may be taking place. An assessment of moving averages reveals a bullish signal that could impact this trend:
Bullish price crossover with adaptative moving average 50
Type : Bullish
Timeframe : Daily
In fact, of the 18 technical indicators analysed by Central Analyzer, 5 are bullish, 5 are neutral and 8 are bearish. Caution: the Central Indicators scanner currently detects an excess:
CCI indicator is oversold : under -100
Type : Neutral
Timeframe : Daily
Pivot points : price is over resistance 1
Type : Neutral
Timeframe : Daily
Ichimoku : price is over the cloud
Type : Bullish
Timeframe : Daily
The analysis of the price chart with Central Patterns scanners does not return any result.
For a small rebound in the very short term, the Central Candlesticks scanner currently notes the presence of this bullish pattern in Japanese candlesticks:
Bullish engulfing lines
Type : Bullish
Timeframe : Daily
| S3 | S2 | S1 | Price | R1 | R2 | R3 | |
|---|---|---|---|---|---|---|---|
| ProTrendLines | 89.88 | 95.92 | 104.58 | 107.06 | 110.47 | 117.63 | 126.68 |
| Change (%) | -16.05% | -10.41% | -2.32% | - | +3.19% | +9.87% | +18.33% |
| Change | -17.18 | -11.14 | -2.48 | - | +3.41 | +10.57 | +19.62 |
| Level | Minor | Intermediate | Major | - | Intermediate | Major | Minor |
Pivot points can also be used to set your price objectives. Here is the price situation in relation to pivot points:
| Pivot points | S3 | S2 | S1 | PP | R1 | R2 | R3 |
|---|---|---|---|---|---|---|---|
| Standard | 97.31 | 99.82 | 102.04 | 104.55 | 106.77 | 109.28 | 111.50 |
| Camarilla | 102.97 | 103.40 | 103.84 | 104.27 | 104.70 | 105.14 | 105.57 |
| Woodie | 97.18 | 99.75 | 101.91 | 104.48 | 106.64 | 109.21 | 111.37 |
| Fibonacci | 99.82 | 101.62 | 102.74 | 104.55 | 106.35 | 107.47 | 109.28 |
| Pivot points | S3 | S2 | S1 | PP | R1 | R2 | R3 |
|---|---|---|---|---|---|---|---|
| Standard | 87.07 | 96.92 | 102.50 | 112.35 | 117.93 | 127.78 | 133.36 |
| Camarilla | 103.84 | 105.25 | 106.67 | 108.08 | 109.49 | 110.91 | 112.32 |
| Woodie | 84.94 | 95.85 | 100.37 | 111.28 | 115.80 | 126.71 | 131.23 |
| Fibonacci | 96.92 | 102.81 | 106.46 | 112.35 | 118.24 | 121.89 | 127.78 |
| Pivot points | S3 | S2 | S1 | PP | R1 | R2 | R3 |
|---|---|---|---|---|---|---|---|
| Standard | 75.12 | 84.74 | 99.26 | 108.88 | 123.40 | 133.02 | 147.54 |
| Camarilla | 107.14 | 109.35 | 111.57 | 113.78 | 115.99 | 118.21 | 120.42 |
| Woodie | 77.57 | 85.97 | 101.71 | 110.11 | 125.85 | 134.25 | 149.99 |
| Fibonacci | 84.74 | 93.96 | 99.66 | 108.88 | 118.10 | 123.80 | 133.02 |
Numerical data
The following is the status of technical indicators and moving averages registered at the time this technical analysis was created:
| RSI (14): | 43.43 | |
| MACD (12,26,9): | -0.4900 | |
| Directional Movement: | -9.14 | |
| AROON (14): | -42.85 | |
| DEMA (21): | 111.59 | |
| Parabolic SAR (0,02-0,02-0,2): | 116.49 | |
| Elder Ray (13): | -4.53 | |
| Super Trend (3,10): | 119.81 | |
| Zig ZAG (10): | 107.06 | |
| VORTEX (21): | 0.9500 | |
| Stochastique (14,3,5): | 20.85 | |
| TEMA (21): | 108.63 | |
| Williams %R (14): | -73.25 | |
| Chande Momentum Oscillator (20): | -13.57 | |
| Repulse (5,40,3): | 0.9400 | |
| ROCnROLL: | -1 | |
| TRIX (15,9): | 0.2100 | |
| Courbe Coppock: | 12.84 |
| MA7: | 108.57 | |
| MA20: | 114.05 | |
| MA50: | 107.74 | |
| MA100: | 101.54 | |
| MAexp7: | 108.61 | |
| MAexp20: | 111.19 | |
| MAexp50: | 108.06 | |
| MAexp100: | 100.81 | |
| Price / MA7: | -1.39% | |
| Price / MA20: | -6.13% | |
| Price / MA50: | -0.63% | |
| Price / MA100: | +5.44% | |
| Price / MAexp7: | -1.43% | |
| Price / MAexp20: | -3.71% | |
| Price / MAexp50: | -0.93% | |
| Price / MAexp100: | +6.20% |
News
The last news published on WTI CRUDE OIL at the time of the generation of this analysis was as follows:
-
 WTI Crude Oil Forecast June 27, 2022
-
WTI Crude Oil Forecast June 24, 2022
-
Technical Analysis: 23/06/2022 - WTI oil futures trade with bearish bias as trendline breached
-
WTI Crude Oil and CAD/JPY Forecast June 23, 2022
-
WTI Crude Oil Forecast June 22, 2022
About author

Online


Add a comment
Comments
0 comments on the analysis WTI CRUDE OIL - Daily