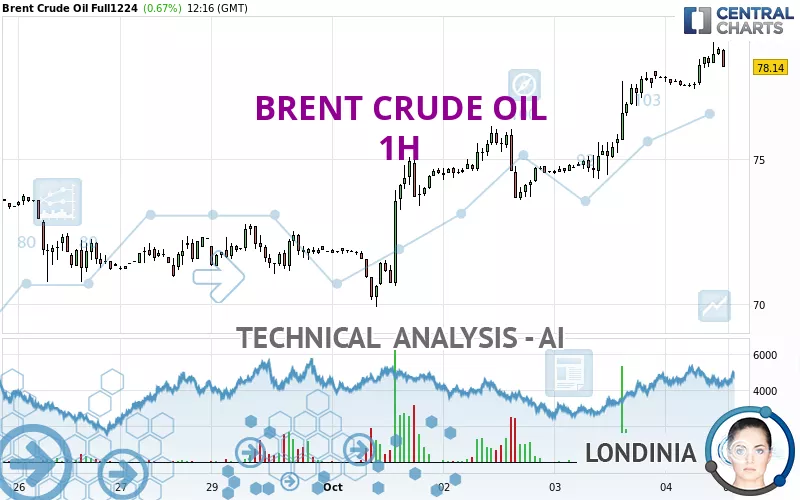
BRENT CRUDE OIL - 1H - Technical analysis published on 10/04/2024 (GMT)
- 105
- 0
Click here for a new analysis!
- Timeframe : 1H
- - Analysis generated on
- Status : LEVEL MAINTAINED
Summary of the analysis

Additional analysis
Quotes
The BRENT CRUDE OIL rating is 78.14 USD. On the day, this instrument gained +0.67% and was between 77.39 USD and 79.00 USD. This implies that the price is at +0.97% from its lowest and at -1.09% from its highest.The Central Gaps scanner detects the formation of a bullish gap marking the strong presence of buyers against sellers at the opening. This formed a quotation gap.
Opening Gap UP
Type : Bullish
Timeframe : Openning
So that you have an overall view of the price change, here is a table showing the variations over several periods:
New HIGH record (1 month)
Type : Bullish
Timeframe : Weekly
Technical
Technical analysis of BRENT CRUDE OIL in 1H shows a strongly overall bullish trend. 92.86% of the signals given by moving averages are bullish. This strongly bullish trend is supported by the strong bullish signals given by short-term moving averages. An assessment of moving averages reveals a bearish signal that could impact this trend:
Bearish trend reversal : adaptative moving average 20
Type : Bearish
Timeframe : 1 hour
In fact, 10 technical indicators on 18 studied are currently bullish. But beware of excesses. The Central Indicators scanner currently detects this:
RSI indicator is overbought : over 70
Type : Neutral
Timeframe : 1 hour
CCI indicator is overbought : over 100
Type : Neutral
Timeframe : 1 hour
Previous candle closed over Bollinger bands
Type : Neutral
Timeframe : 1 hour
MACD indicator: bearish divergence
Type : Bearish
Timeframe : 1 hour
Williams %R indicator is overbought : over -20
Type : Neutral
Timeframe : 1 hour
Pivot points : price is over resistance 2
Type : Neutral
Timeframe : Weekly
MACD crosses DOWN its Moving Average
Type : Bearish
Timeframe : 1 hour
No signals are given by Central Patterns, a market scanner specialised in chart patterns, resistances and supports.
Central Candlesticks, the scanner specialised in Japanese candlesticks, detects these bearish signals that could support the hypothesis of a small drop in the very short term:
Bearish harami
Type : Bearish
Timeframe : 1 hour
Bearish harami cross
Type : Bearish
Timeframe : 1 hour
| S3 | S2 | S1 | Price | R1 | R2 | R3 | |
|---|---|---|---|---|---|---|---|
| ProTrendLines | 74.85 | 75.57 | 77.25 | 78.14 | 81.01 | 82.64 | 86.21 |
| Change (%) | -4.21% | -3.29% | -1.14% | - | +3.67% | +5.76% | +10.33% |
| Change | -3.29 | -2.57 | -0.89 | - | +2.87 | +4.50 | +8.07 |
| Level | Major | Minor | Minor | - | Intermediate | Minor | Major |
To determine price objectives, it is also possible to use the pivot points. Here is the price position in relation to pivot points:
| Pivot points | S3 | S2 | S1 | PP | R1 | R2 | R3 |
|---|---|---|---|---|---|---|---|
| Standard | 71.64 | 72.97 | 75.30 | 76.63 | 78.96 | 80.29 | 82.62 |
| Camarilla | 76.61 | 76.95 | 77.29 | 77.62 | 77.96 | 78.29 | 78.63 |
| Woodie | 72.13 | 73.22 | 75.79 | 76.88 | 79.45 | 80.54 | 83.11 |
| Fibonacci | 72.97 | 74.37 | 75.24 | 76.63 | 78.03 | 78.90 | 80.29 |
| Pivot points | S3 | S2 | S1 | PP | R1 | R2 | R3 |
|---|---|---|---|---|---|---|---|
| Standard | 64.48 | 67.47 | 69.58 | 72.57 | 74.68 | 77.67 | 79.78 |
| Camarilla | 70.28 | 70.75 | 71.21 | 71.68 | 72.15 | 72.62 | 73.08 |
| Woodie | 64.03 | 67.25 | 69.13 | 72.35 | 74.23 | 77.45 | 79.33 |
| Fibonacci | 67.47 | 69.42 | 70.63 | 72.57 | 74.52 | 75.73 | 77.67 |
| Pivot points | S3 | S2 | S1 | PP | R1 | R2 | R3 |
|---|---|---|---|---|---|---|---|
| Standard | 59.94 | 64.17 | 68.86 | 73.09 | 77.78 | 82.01 | 86.70 |
| Camarilla | 71.11 | 71.93 | 72.74 | 73.56 | 74.38 | 75.20 | 76.01 |
| Woodie | 60.18 | 64.29 | 69.10 | 73.21 | 78.02 | 82.13 | 86.94 |
| Fibonacci | 64.17 | 67.57 | 69.68 | 73.09 | 76.49 | 78.60 | 82.01 |
Numerical data
The following is the status of technical indicators and moving averages registered at the time this technical analysis was created:
| RSI (14): | 72.40 | |
| MACD (12,26,9): | 0.7200 | |
| Directional Movement: | 24.88 | |
| AROON (14): | 28.57 | |
| DEMA (21): | 78.67 | |
| Parabolic SAR (0,02-0,02-0,2): | 77.73 | |
| Elder Ray (13): | 0.60 | |
| Super Trend (3,10): | 77.48 | |
| Zig ZAG (10): | 78.62 | |
| VORTEX (21): | 1.3400 | |
| Stochastique (14,3,5): | 78.88 | |
| TEMA (21): | 78.77 | |
| Williams %R (14): | -22.36 | |
| Chande Momentum Oscillator (20): | 0.83 | |
| Repulse (5,40,3): | 0.1400 | |
| ROCnROLL: | 1 | |
| TRIX (15,9): | 0.1400 | |
| Courbe Coppock: | 2.02 |
| MA7: | 74.03 | |
| MA20: | 73.09 | |
| MA50: | 75.30 | |
| MA100: | 78.10 | |
| MAexp7: | 78.33 | |
| MAexp20: | 77.70 | |
| MAexp50: | 76.41 | |
| MAexp100: | 75.19 | |
| Price / MA7: | +5.55% | |
| Price / MA20: | +6.91% | |
| Price / MA50: | +3.77% | |
| Price / MA100: | +0.05% | |
| Price / MAexp7: | -0.24% | |
| Price / MAexp20: | +0.57% | |
| Price / MAexp50: | +2.26% | |
| Price / MAexp100: | +3.92% |
News
The last news published on BRENT CRUDE OIL at the time of the generation of this analysis was as follows:
-
 Time to go long on Brent Crude Oil?
-
The media should be investigating this: Brent Bozell #shorts
-
Kamala Harris is going to be a 'huge problem' if Biden is replaced: Brent Bozell
-
Trading volatility: Brent around OPEC meeting
-
'FASTEN YOUR SEATBELTS': Brent Bozell warns of Alex Soros' Open Society Foundations takeover
About author

Online


Add a comment
Comments
0 comments on the analysis BRENT CRUDE OIL - 1H