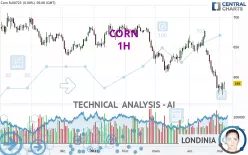
CORN - 1H - Technical analysis published on 05/05/2023 (GMT)
- 223
- 0
Click here for a new analysis!
- Timeframe : 1H
- - Analysis generated on
- Status : LEVEL MAINTAINED

Summary of the analysis
Additional analysis
Quotes
The CORN rating is 594.25 USD. On the day, this instrument gained +0.89% with the lowest point at 588.50 USD and the highest point at 596.25 USD. The deviation from the price is +0.98% for the low point and -0.34% for the high point.A bearish opening was detected by the Central Gaps scanner. Sellers are trying to impose a bearish trend in the very short term.
Bearish opening
Type : Bearish
Timeframe : Openning
A study of price movements over other periods shows the following variations:
Near a new LOW record (1st january)
Type : Bearish
Timeframe : Weekly
Near a new LOW record (1 month)
Type : Bearish
Timeframe : Weekly
Technical
Technical analysis of this 1H chart of CORN indicates that the overall trend is strongly bullish. 89.29% of the signals given by moving averages are bullish. The overall trend is supported by the strong bullish signals from short-term moving averages. The Central Indicators market scanner currently does not detect any result that concerns moving averages.
The probability of a further increase is high given the direction of the technical indicators.
Caution: the Central Indicators scanner currently detects an excess:
RSI indicator is overbought : over 70
Type : Neutral
Timeframe : 1 hour
CCI indicator is overbought : over 100
Type : Neutral
Timeframe : 1 hour
Williams %R indicator is overbought : over -20
Type : Neutral
Timeframe : 1 hour
Pivot points : price is over resistance 1
Type : Neutral
Timeframe : 1 hour
Price is back over the pivot point
Type : Bullish
Timeframe : Weekly
Central Patterns, the scanner specializing in chart patterns, did not identify any signals.
No result was found by the Central Candlesticks scanner on Japanese candlesticks.
| S3 | S2 | S1 | Price | R1 | R2 | R3 | |
|---|---|---|---|---|---|---|---|
| ProTrendLines | 577.62 | 587.25 | 592.00 | 594.25 | 602.25 | 611.85 | 626.25 |
| Change (%) | -2.80% | -1.18% | -0.38% | - | +1.35% | +2.96% | +5.38% |
| Change | -16.63 | -7.00 | -2.25 | - | +8.00 | +17.60 | +32.00 |
| Level | Intermediate | Minor | Intermediate | - | Intermediate | Major | Minor |
Attention could also be paid to pivot points to set price objectives:
| Pivot points | S3 | S2 | S1 | PP | R1 | R2 | R3 |
|---|---|---|---|---|---|---|---|
| Standard | 568.33 | 573.67 | 581.33 | 586.67 | 594.33 | 599.67 | 607.33 |
| Camarilla | 585.43 | 586.62 | 587.81 | 589.00 | 590.19 | 591.38 | 592.58 |
| Woodie | 569.50 | 574.25 | 582.50 | 587.25 | 595.50 | 600.25 | 608.50 |
| Fibonacci | 573.67 | 578.63 | 581.70 | 586.67 | 591.63 | 594.70 | 599.67 |
| Pivot points | S3 | S2 | S1 | PP | R1 | R2 | R3 |
|---|---|---|---|---|---|---|---|
| Standard | 519.33 | 545.67 | 565.33 | 591.67 | 611.33 | 637.67 | 657.33 |
| Camarilla | 572.35 | 576.57 | 580.78 | 585.00 | 589.22 | 593.43 | 597.65 |
| Woodie | 516.00 | 544.00 | 562.00 | 590.00 | 608.00 | 636.00 | 654.00 |
| Fibonacci | 545.67 | 563.24 | 574.10 | 591.67 | 609.24 | 620.10 | 637.67 |
| Pivot points | S3 | S2 | S1 | PP | R1 | R2 | R3 |
|---|---|---|---|---|---|---|---|
| Standard | 479.67 | 525.83 | 555.17 | 601.33 | 630.67 | 676.83 | 706.17 |
| Camarilla | 563.74 | 570.66 | 577.58 | 584.50 | 591.42 | 598.34 | 605.26 |
| Woodie | 471.25 | 521.63 | 546.75 | 597.13 | 622.25 | 672.63 | 697.75 |
| Fibonacci | 525.83 | 554.67 | 572.49 | 601.33 | 630.17 | 647.99 | 676.83 |
Numerical data
The following is the status of the technical indicators and moving averages at the time of publication of this technical analysis:
| RSI (14): | 72.11 | |
| MACD (12,26,9): | 2.1100 | |
| Directional Movement: | 14.91 | |
| AROON (14): | 78.57 | |
| DEMA (21): | 593.94 | |
| Parabolic SAR (0,02-0,02-0,2): | 590.00 | |
| Elder Ray (13): | 2.66 | |
| Super Trend (3,10): | 588.78 | |
| Zig ZAG (10): | 594.75 | |
| VORTEX (21): | 1.3600 | |
| Stochastique (14,3,5): | 80.29 | |
| TEMA (21): | 594.83 | |
| Williams %R (14): | -13.33 | |
| Chande Momentum Oscillator (20): | 4.25 | |
| Repulse (5,40,3): | 0.3700 | |
| ROCnROLL: | 1 | |
| TRIX (15,9): | 0.0500 | |
| Courbe Coppock: | 1.51 |
| MA7: | 586.18 | |
| MA20: | 609.80 | |
| MA50: | 605.98 | |
| MA100: | 621.04 | |
| MAexp7: | 593.34 | |
| MAexp20: | 591.27 | |
| MAexp50: | 588.30 | |
| MAexp100: | 588.89 | |
| Price / MA7: | +1.38% | |
| Price / MA20: | -2.55% | |
| Price / MA50: | -1.94% | |
| Price / MA100: | -4.31% | |
| Price / MAexp7: | +0.15% | |
| Price / MAexp20: | +0.50% | |
| Price / MAexp50: | +1.01% | |
| Price / MAexp100: | +0.91% |
News
The latest news and videos published on CORN at the time of the analysis were as follows:
-
 Farmers are battling corn surplus
-
Kellogg's apologizes after a Corn Pops box that some say 'teaches kids racism' ignites fury
-
Drought and corruption fuel corn crisis in Kenya | DW English
-
How corn mazes saved one family’s farming business
-
EU court backs Italian famer who grows GM corn against national law
About author

Online


Add a comment
Comments
0 comments on the analysis CORN - 1H