CORN overview
CORN > Analyses
 Thank you
Reply
Thank you
Reply
Timeframe : 1H - Simple chart
Status : INVALID
The strong short-term decrease of CORN should quickly allow the basic trend to become bearish. As long as the price remains below the resistance located at 416.62 USD, a sale could be considered. The…
CORN > Analyses

 Thank you
Reply
Thank you
Reply
Londinia
has published a new analysis for winewa8300.
- 0
- 98612
- 16057
- 0
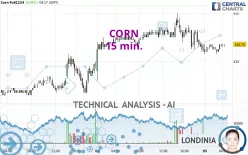
Timeframe : 15 min. - Simple chart
Status : NEUTRAL
A slightly bullish trend and a neutral short term. With such a pattern, it is difficult to favour buying or selling. The first resistance is located at 419.83 USD. The first support is located at…
CORN > Analyses
 Thank you
Reply
Thank you
Reply
Timeframe : Daily - Simple chart
Status : INVALID
There is a bearish trend on CORN both at the basic level and in the short term. A sale could be considered, so long as the price remains below 417.25 USD. Each support break is a strong signal that…
CORN > Analyses
 Thank you
Reply
Thank you
Reply
Timeframe : 1H - Simple chart
Status : INVALID
We are currently in a phase of short-term indecision. In a case like this, you could favour trades in the direction of the basic trend on CORN. As long as you are under the resistance located at…
CORN > Analyses
 Thank you
Reply
Thank you
Reply
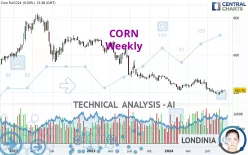
Timeframe : Weekly - Simple chart
Status : INVALID
CORN is part of a very strong bearish trend. Traders may consider trading only short positions (for sale) as long as the price remains well below 435.67 USD. The next support located at 367.21 USD is…
CORN > Analyses
 Thank you
Reply
Thank you
Reply
Timeframe : Weekly - Simple chart
Status : INVALID
The bearish trend is currently very strong for CORN. As long as the price remains below the resistance at 435.67 USD, you could try to take advantage of the bearish rally. The first bearish objective…
CORN > Analyses
 Thank you
Reply
Thank you
Reply
Timeframe : Weekly - Simple chart
Status : INVALID
CORN is part of a very strong bearish trend. Traders may consider trading only short positions (for sale) as long as the price remains well below 435.67 USD. The next support located at 367.21 USD is…
CORN > Analyses

 Thank you
Reply
Thank you
Reply
tariyia has published a new analysis.
- 6
- 122
- 86
- 5
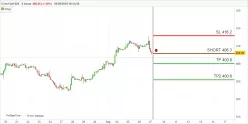
Timeframe : 2H - Chart + Trading signal
CORN @ (Timeframe 2 Hour)
Conditions:
Bearish price crossover with Moving Average 50 (2H)
Moving Average bearish crossovers : AMA20 & AMA50 (2H)
At Higher Timeframe
Momentum (10) Bearish…

