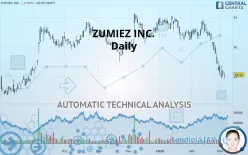
ZUMIEZ INC. - Daily - Technical analysis published on 03/06/2020 (GMT)
- 357
- 0
- Who voted?
Click here for a new analysis!
- Timeframe : Daily
- - Analysis generated on
- Status : TARGET REACHED

Summary of the analysis

Additional analysis
Quotes
The ZUMIEZ INC. price is 25.31 USD. On the day, this instrument lost -2.32% and was between 24.66 USD and 25.68 USD. This implies that the price is at +2.64% from its lowest and at -1.44% from its highest.A bearish opening was detected by the Central Gaps scanner. Sellers are trying to impose a bearish trend in the very short term.
Bearish opening
Type : Bearish
Timeframe : Openning
A study of price movements over other periods shows the following variations:
Near a new LOW record (1st january)
Type : Bearish
Timeframe : Weekly
Near a new LOW record (1 month)
Type : Bearish
Timeframe : Weekly
Technical
Technical analysis of this Daily chart of ZUMIEZ INC. indicates that the overall trend is strongly bearish. The signals given by moving averages are 89.29% bearish. This strong bearish trend is confirmed by the strong signals currently being given by short-term moving averages. There is no crossing of moving average by the price or crossing of moving averages between themselves.
An assessment of technical indicators does not currently provide any relevant information on the direction of future price movements.
Caution: the Central Indicators scanner currently detects an excess:
RSI indicator is oversold : under 30
Type : Neutral
Timeframe : Daily
CCI indicator is oversold : under -100
Type : Neutral
Timeframe : Daily
Williams %R indicator is oversold : under -80
Type : Neutral
Timeframe : Daily
Price is back over the pivot point
Type : Bullish
Timeframe : Daily
Price is back under the pivot point
Type : Bearish
Timeframe : Weekly
The Central Patterns scanner, which studies chart patterns, resistances and supports, has identified these signals:
Near horizontal support
Type : Bullish
Timeframe : Daily
Support of channel is broken
Type : Bearish
Timeframe : Daily
The Central Candlesticks scanner which studies Japanese candlesticks did not detect anything.
| S3 | S2 | S1 | Price | R1 | R2 | R3 | |
|---|---|---|---|---|---|---|---|
| ProTrendLines | 18.10 | 22.38 | 23.83 | 25.31 | 25.95 | 28.81 | 31.25 |
| Change (%) | -28.49% | -11.58% | -5.85% | - | +2.53% | +13.83% | +23.47% |
| Change | -7.21 | -2.93 | -1.48 | - | +0.64 | +3.50 | +5.94 |
| Level | Major | Intermediate | Minor | - | Major | Major | Major |
Pivot points can also be used to set your price objectives. Here is the price situation in relation to pivot points:
| Pivot points | S3 | S2 | S1 | PP | R1 | R2 | R3 |
|---|---|---|---|---|---|---|---|
| Standard | 24.03 | 24.45 | 25.18 | 25.60 | 26.33 | 26.75 | 27.48 |
| Camarilla | 25.59 | 25.70 | 25.81 | 25.91 | 26.02 | 26.12 | 26.23 |
| Woodie | 24.19 | 24.53 | 25.34 | 25.68 | 26.49 | 26.83 | 27.64 |
| Fibonacci | 24.45 | 24.89 | 25.16 | 25.60 | 26.04 | 26.31 | 26.75 |
| Pivot points | S3 | S2 | S1 | PP | R1 | R2 | R3 |
|---|---|---|---|---|---|---|---|
| Standard | 19.75 | 22.86 | 24.69 | 27.80 | 29.63 | 32.74 | 34.57 |
| Camarilla | 25.17 | 25.62 | 26.08 | 26.53 | 26.98 | 27.44 | 27.89 |
| Woodie | 19.12 | 22.54 | 24.06 | 27.48 | 29.00 | 32.42 | 33.94 |
| Fibonacci | 22.86 | 24.74 | 25.91 | 27.80 | 29.68 | 30.85 | 32.74 |
| Pivot points | S3 | S2 | S1 | PP | R1 | R2 | R3 |
|---|---|---|---|---|---|---|---|
| Standard | 14.90 | 20.43 | 23.48 | 29.01 | 32.06 | 37.59 | 40.64 |
| Camarilla | 24.17 | 24.96 | 25.74 | 26.53 | 27.32 | 28.10 | 28.89 |
| Woodie | 13.66 | 19.81 | 22.24 | 28.39 | 30.82 | 36.97 | 39.40 |
| Fibonacci | 20.43 | 23.71 | 25.73 | 29.01 | 32.29 | 34.31 | 37.59 |
Numerical data
The following is the status of technical indicators and moving averages registered at the time this technical analysis was created:
| RSI (14): | 26.18 | |
| MACD (12,26,9): | -1.9100 | |
| Directional Movement: | -30.35 | |
| AROON (14): | -85.71 | |
| DEMA (21): | 26.92 | |
| Parabolic SAR (0,02-0,02-0,2): | 28.62 | |
| Elder Ray (13): | -2.85 | |
| Super Trend (3,10): | 29.32 | |
| Zig ZAG (10): | 25.31 | |
| VORTEX (21): | 0.7200 | |
| Stochastique (14,3,5): | 8.01 | |
| TEMA (21): | 25.48 | |
| Williams %R (14): | -92.83 | |
| Chande Momentum Oscillator (20): | -7.08 | |
| Repulse (5,40,3): | -1.8000 | |
| ROCnROLL: | 2 | |
| TRIX (15,9): | -0.5600 | |
| Courbe Coppock: | 38.32 |
| MA7: | 26.36 | |
| MA20: | 30.15 | |
| MA50: | 31.99 | |
| MA100: | 31.78 | |
| MAexp7: | 26.59 | |
| MAexp20: | 29.12 | |
| MAexp50: | 30.84 | |
| MAexp100: | 30.85 | |
| Price / MA7: | -3.98% | |
| Price / MA20: | -16.05% | |
| Price / MA50: | -20.88% | |
| Price / MA100: | -20.36% | |
| Price / MAexp7: | -4.81% | |
| Price / MAexp20: | -13.08% | |
| Price / MAexp50: | -17.93% | |
| Price / MAexp100: | -17.96% |
News
The last news published on ZUMIEZ INC. at the time of the generation of this analysis was as follows:
- Zumiez Inc. to Broadcast Review of Fourth Quarter and Fiscal 2019 Full Year Financial Results Over the Internet
- Zumiez Inc. Reports Holiday 2019 Sales Results
- Zumiez Inc. Announces Fiscal 2019 Third Quarter Results
- Zumiez Inc. to Broadcast Review of Third Quarter Fiscal 2019 Financial Results Over the Internet
- Zumiez Announces Participation in the B. Riley FBR 5th Annual Consumer & Media Conference
About author

Online


Add a comment
Comments
0 comments on the analysis ZUMIEZ INC. - Daily