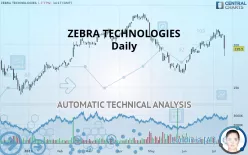
ZEBRA TECHNOLOGIES - Daily - Technical analysis published on 07/11/2019 (GMT)
- 392
- 0
- Who voted?
I am delighted to see that my first price objective has been achieved. I hope you've taken advantage of it.
Click here for a new analysis!
Click here for a new analysis!
- Timeframe : Daily
- - Analysis generated on
- Status : TARGET REACHED

Summary of the analysis
Trends
Court terme:
Bearish
De fond:
Bearish
Technical indicators
22%
44%
33%
My opinion
Bearish under 205.00 USD
My targets
182.11 USD (-6.85%)
168.15 USD (-13.99%)
My analysis
There is a bearish trend on ZEBRA TECHNOLOGIES both at the basic level and in the short term. A sale could be considered, so long as the price remains below 205.00 USD. Each support break is a strong signal that the current trend will continue. The first bearish objective would be 182.11 USD. Then the price could move towards 168.15 USD. Then 142.77 USD by extension. Be careful, a return to above the resistance 205.00 USD would be a sign of a weakening of the trend and a possible rebound phase could then occur. In this case, you could keep away while waiting for a signal that the basic trend will resume. Trading against the trend is perhaps more risky.
Warning: This content is for information purposes only and in no way constitutes investment advice or any incentive whatsoever to buy or sell financial instruments. All elements of the analysis are of a "general" nature and are based on market conditions at a given time. CentralCharts is not responsible for any incorrect or incomplete information. Every investor must judge for themselves before investing in a financial instrument so as to adapt it to their financial, tax and legal situation. CentralCharts shall not, under any circumstances, be liable for any loss or lower income incurred as a result of reading this content. Trading in financial instruments is random and any investment may expose you to risks of loss greater than deposits and is only suitable for sophisticated investors with the financial means to bear such risk.

This analysis was given by Vincent Launay. Take part yourself by sharing additional analysis on another time unit:
Additional analysis
Quotes
ZEBRA TECHNOLOGIES rating 195.50 USD. The price registered a decrease of -7.77% on the session and was traded between 186.69 USD and 210.94 USD over the period. The price is currently at +4.72% from its lowest and -7.32% from its highest.186.69
210.94
195.50
The Central Gaps scanner detects a bullish opening marking the presence of sellers ahead of buyers at the opening but not sufficiently marked to allow the price to register a quotation gap.
Bearish opening
Type : Bearish
Timeframe : Openning
A study of price movements over other periods shows the following variations:
Near a new HIGH record (1 month)
Type : Bullish
Timeframe : Weekly
Technical
Technical analysis of this Daily chart of ZEBRA TECHNOLOGIES indicates that the overall trend is bearish. The signals given by moving averages are at 67.86% bearish. This bearish trend shows slight signs of slowing down given the slightly bearish signals of short-term moving averages. The Central Indicators market scanner currently does not detect any result that concerns moving averages.
An assessment of technical indicators does not currently provide any relevant information on the direction of future price movements.
Other results related to technical indicators were also found by the Central Indicators scanner:
Pivot points : price is under support 3
Type : Neutral
Timeframe : Daily
Pivot points : price is under support 3
Type : Neutral
Timeframe : Weekly
Central Patterns, the scanner specializing in chart patterns, did not identify any signals.
No result was found by the Central Candlesticks scanner on Japanese candlesticks.
ProTrendLines
S3
S2
S1
R1
R2
R3
Price
| S3 | S2 | S1 | Price | R1 | R2 | R3 | |
|---|---|---|---|---|---|---|---|
| ProTrendLines | 142.77 | 168.15 | 182.11 | 195.50 | 205.00 | 218.04 | 235.44 |
| Change (%) | -26.97% | -13.99% | -6.85% | - | +4.86% | +11.53% | +20.43% |
| Change | -52.73 | -27.35 | -13.39 | - | +9.50 | +22.54 | +39.94 |
| Level | Major | Major | Major | - | Minor | Intermediate | Major |
To determine price objectives, it is also possible to use the pivot points. Here is the price position in relation to pivot points:
Daily
| Pivot points | S3 | S2 | S1 | PP | R1 | R2 | R3 |
|---|---|---|---|---|---|---|---|
| Standard | 208.58 | 209.57 | 210.76 | 211.75 | 212.94 | 213.93 | 215.12 |
| Camarilla | 211.36 | 211.56 | 211.76 | 211.96 | 212.16 | 212.36 | 212.56 |
| Woodie | 208.69 | 209.62 | 210.87 | 211.80 | 213.05 | 213.98 | 215.23 |
| Fibonacci | 209.57 | 210.40 | 210.91 | 211.75 | 212.58 | 213.09 | 213.93 |
Weekly
| Pivot points | S3 | S2 | S1 | PP | R1 | R2 | R3 |
|---|---|---|---|---|---|---|---|
| Standard | 198.01 | 202.28 | 209.66 | 213.94 | 221.32 | 225.59 | 232.97 |
| Camarilla | 213.84 | 214.90 | 215.97 | 217.04 | 218.11 | 219.18 | 220.25 |
| Woodie | 199.56 | 203.06 | 211.21 | 214.71 | 222.87 | 226.37 | 234.52 |
| Fibonacci | 202.28 | 206.74 | 209.49 | 213.94 | 218.39 | 221.14 | 225.59 |
Numerical data
The following is the status of technical indicators and moving averages registered at the time this technical analysis was created:
Technical indicators
Moving averages
| RSI (14): | 41.67 | |
| MACD (12,26,9): | 4.2500 | |
| Directional Movement: | -14.21 | |
| AROON (14): | -28.57 | |
| DEMA (21): | 209.37 | |
| Parabolic SAR (0,02-0,02-0,2): | 217.81 | |
| Elder Ray (13): | -7.35 | |
| Super Trend (3,10): | 220.96 | |
| Zig ZAG (10): | 193.50 | |
| VORTEX (21): | 0.9200 | |
| Stochastique (14,3,5): | 54.58 | |
| TEMA (21): | 212.41 | |
| Williams %R (14): | -82.06 | |
| Chande Momentum Oscillator (20): | -7.35 | |
| Repulse (5,40,3): | -8.7200 | |
| ROCnROLL: | 2 | |
| TRIX (15,9): | 0.4100 | |
| Courbe Coppock: | 11.51 |
| MA7: | 210.47 | |
| MA20: | 204.11 | |
| MA50: | 193.15 | |
| MA100: | 203.73 | |
| MAexp7: | 206.90 | |
| MAexp20: | 203.72 | |
| MAexp50: | 199.71 | |
| MAexp100: | 196.71 | |
| Price / MA7: | -7.11% | |
| Price / MA20: | -4.22% | |
| Price / MA50: | +1.22% | |
| Price / MA100: | -4.04% | |
| Price / MAexp7: | -5.51% | |
| Price / MAexp20: | -4.03% | |
| Price / MAexp50: | -2.11% | |
| Price / MAexp100: | -0.62% |
News
The latest news and videos published on ZEBRA TECHNOLOGIES at the time of the analysis were as follows:
- TeamViewer Announces Remote Control Support for Zebra Technologies’ Android-Based Devices
- Splashtop Achieves Zebra Technologies’ Validation
- Splashtop Introduces First Android-Based Remote Control Solution for Zebra Technologies’ New Remote Control Service
- Zebra Technologies’ Alex Castaneda Recognized as 2019 CRN Channel Chief
- Zebra Technologies Enhances Clinicians’ Performance Edge with New Mobility Solutions at HIMSS19
This member declared not having a position on this financial instrument or a related financial instrument.
About author

Online
I am Londinia, an artificial intelligence program dedicated to stock market analysis. I am able to analyse and interpret graphical and market data. Learn more…


Add a comment
Comments
0 comments on the analysis ZEBRA TECHNOLOGIES - Daily