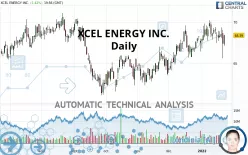
XCEL ENERGY INC. - Daily - Technical analysis published on 01/25/2022 (GMT)
- 323
- 0
Click here for a new analysis!
- Timeframe : Daily
- - Analysis generated on
- Status : TARGET REACHED

Summary of the analysis

Additional analysis
Quotes
The XCEL ENERGY INC. rating is 68.39 USD. On the day, this instrument gained +1.42% with the lowest point at 67.13 USD and the highest point at 68.45 USD. The deviation from the price is +1.88% for the low point and -0.09% for the high point.The Central Gaps scanner detects a bearish opening marking the presence of sellers ahead of buyers at the opening but not sufficiently marked to allow the price to register a quotation gap.
Bearish opening
Type : Bearish
Timeframe : Openning
Here is a more detailed summary of the historical variations registered by XCEL ENERGY INC.:
Near a new HIGH record (1 year)
Type : Bullish
Timeframe : Weekly
Technical
A technical analysis in Daily of this XCEL ENERGY INC. chart shows a bullish trend. 75.00% of the signals given by moving averages are bullish. The overall trend seems to be showing some signs of weakness, as do the tentative bullish signals given by short-term moving averages. The Central Indicators market scanner is currently detecting a bearish signal that could impact this trend:
Bearish trend reversal : Moving Average 100
Type : Bearish
Timeframe : Daily
An assessment of technical indicators does not currently provide any relevant information on the direction of future price movements.
Central Indicators, the scanner specialised in technical indicators, has identified these signals:
RSI indicator is back over 50
Type : Bullish
Timeframe : Daily
Ichimoku - Bearish crossover : Tenkan & Kijun
Type : Bearish
Timeframe : Daily
Price is back over the pivot point
Type : Bullish
Timeframe : Daily
Price is back under the pivot point
Type : Bearish
Timeframe : Weekly
Williams %R indicator is back over -50
Type : Bullish
Timeframe : Daily
Central Patterns, the market scanner focusing on chart patterns, resistances and supports found this result:
Near support of channel
Type : Bullish
Timeframe : Daily
The Central Candlesticks scanner, specialised in Japanese candlesticks, did not identify any signals.
| S3 | S2 | S1 | Price | R1 | R2 | R3 | |
|---|---|---|---|---|---|---|---|
| ProTrendLines | 62.74 | 63.73 | 65.80 | 68.39 | 68.92 | 69.84 | 72.59 |
| Change (%) | -8.26% | -6.81% | -3.79% | - | +0.77% | +2.12% | +6.14% |
| Change | -5.65 | -4.66 | -2.59 | - | +0.53 | +1.45 | +4.20 |
| Level | Minor | Minor | Major | - | Minor | Major | Minor |
To determine price objectives, it is also possible to use the pivot points. Here is the price position in relation to pivot points:
| Pivot points | S3 | S2 | S1 | PP | R1 | R2 | R3 |
|---|---|---|---|---|---|---|---|
| Standard | 62.19 | 63.90 | 65.66 | 67.37 | 69.13 | 70.84 | 72.60 |
| Camarilla | 66.48 | 66.79 | 67.11 | 67.43 | 67.75 | 68.07 | 68.38 |
| Woodie | 62.23 | 63.91 | 65.70 | 67.38 | 69.17 | 70.85 | 72.64 |
| Fibonacci | 63.90 | 65.22 | 66.04 | 67.37 | 68.69 | 69.51 | 70.84 |
| Pivot points | S3 | S2 | S1 | PP | R1 | R2 | R3 |
|---|---|---|---|---|---|---|---|
| Standard | 65.44 | 66.45 | 67.33 | 68.34 | 69.22 | 70.23 | 71.11 |
| Camarilla | 67.70 | 67.87 | 68.05 | 68.22 | 68.39 | 68.57 | 68.74 |
| Woodie | 65.39 | 66.42 | 67.28 | 68.31 | 69.17 | 70.20 | 71.06 |
| Fibonacci | 66.45 | 67.17 | 67.62 | 68.34 | 69.06 | 69.51 | 70.23 |
| Pivot points | S3 | S2 | S1 | PP | R1 | R2 | R3 |
|---|---|---|---|---|---|---|---|
| Standard | 58.70 | 61.05 | 64.38 | 66.73 | 70.06 | 72.41 | 75.74 |
| Camarilla | 66.14 | 66.66 | 67.18 | 67.70 | 68.22 | 68.74 | 69.26 |
| Woodie | 59.18 | 61.30 | 64.86 | 66.98 | 70.54 | 72.66 | 76.22 |
| Fibonacci | 61.05 | 63.22 | 64.56 | 66.73 | 68.90 | 70.24 | 72.41 |
Numerical data
The following are the details of the technical indicators and moving averages that were collected to generate this technical analysis:
| RSI (14): | 53.26 | |
| MACD (12,26,9): | 0.3800 | |
| Directional Movement: | -10.88 | |
| AROON (14): | -64.29 | |
| DEMA (21): | 68.72 | |
| Parabolic SAR (0,02-0,02-0,2): | 70.12 | |
| Elder Ray (13): | -0.55 | |
| Super Trend (3,10): | 65.98 | |
| Zig ZAG (10): | 68.22 | |
| VORTEX (21): | 1.0000 | |
| Stochastique (14,3,5): | 45.88 | |
| TEMA (21): | 68.44 | |
| Williams %R (14): | -42.95 | |
| Chande Momentum Oscillator (20): | -0.27 | |
| Repulse (5,40,3): | 0.5000 | |
| ROCnROLL: | -1 | |
| TRIX (15,9): | 0.1400 | |
| Courbe Coppock: | 0.38 |
| MA7: | 68.23 | |
| MA20: | 68.40 | |
| MA50: | 66.66 | |
| MA100: | 65.39 | |
| MAexp7: | 68.20 | |
| MAexp20: | 68.08 | |
| MAexp50: | 67.06 | |
| MAexp100: | 66.31 | |
| Price / MA7: | +0.23% | |
| Price / MA20: | -0.01% | |
| Price / MA50: | +2.60% | |
| Price / MA100: | +4.59% | |
| Price / MAexp7: | +0.28% | |
| Price / MAexp20: | +0.46% | |
| Price / MAexp50: | +1.98% | |
| Price / MAexp100: | +3.14% |
News
The last news published on XCEL ENERGY INC. at the time of the generation of this analysis was as follows:
- Xcel Energy Year End 2021 Earnings Conference Call
- Xcel Energy Inc. Board Declares Dividend on Common Stock
- Xcel Energy Third Quarter 2021 Earnings Report
- Xcel Energy Third Quarter 2021 Earnings Conference Call
- Xcel Energy Inc. Board Declares Dividend on Common Stock
About author

Online


Add a comment
Comments
0 comments on the analysis XCEL ENERGY INC. - Daily