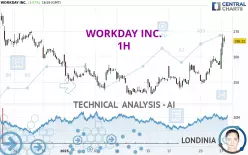
WORKDAY INC. - 1H - Technical analysis published on 01/27/2025 (GMT)
- 104
- 0
Click here for a new analysis!
- Timeframe : 1H
- - Analysis generated on
- Status : INVALID

Summary of the analysis

Additional analysis
Quotes
WORKDAY INC. rating 266.22 USD. The price has increased by +3.07% since the last closing with the lowest point at 255.22 USD and the highest point at 268.94 USD. The deviation from the price is +4.31% for the low point and -1.01% for the high point.The Central Gaps scanner detects the formation of a bearish gap marking the strong presence of sellers ahead of buyers at the opening. This formed a quotation gap.
Opening Gap DOWN
Type : Bearish
Timeframe : Openning
A study of price movements over other periods shows the following variations:
New HIGH record (1st january)
Type : Bullish
Timeframe : Weekly
Near a new LOW record (1 month)
Type : Bearish
Timeframe : Weekly
Technical
Technical analysis of this 1H chart of WORKDAY INC. indicates that the overall trend is strongly bullish. 92.86% of the signals given by moving averages are bullish. This strongly bullish trend is supported by the strong bullish signals given by short-term moving averages. There is no crossing of moving average by the price or crossing of moving averages between themselves.
In fact, 17 technical indicators on 18 studied are currently bullish. But beware of excesses. The Central Indicators scanner currently detects this:
RSI indicator is overbought : over 70
Type : Neutral
Timeframe : 1 hour
CCI indicator is overbought : over 100
Type : Neutral
Timeframe : 1 hour
Previous candle closed over Bollinger bands
Type : Neutral
Timeframe : 1 hour
Williams %R indicator is overbought : over -20
Type : Neutral
Timeframe : 1 hour
Pivot points : price is over resistance 1
Type : Neutral
Timeframe : Weekly
Pivot points : price is over resistance 3
Type : Neutral
Timeframe : 1 hour
An analysis of the price chart with the Central Patterns scanner (detector of chart patterns and resistances and supports) shows several results that can have an impact on the price change:
Near horizontal resistance
Type : Bearish
Timeframe : 1 hour
Resistance of channel is broken
Type : Bullish
Timeframe : 1 hour
The presence of a bearish pattern in Japanese candlesticks detected by Central Candlesticks that could cause a correction in the very short term was also detected:
Bearish harami
Type : Bearish
Timeframe : 1 hour
| S3 | S2 | S1 | Price | R1 | R2 | R3 | |
|---|---|---|---|---|---|---|---|
| ProTrendLines | 249.20 | 254.88 | 264.86 | 266.22 | 269.92 | 277.04 | 281.36 |
| Change (%) | -6.39% | -4.26% | -0.51% | - | +1.39% | +4.06% | +5.69% |
| Change | -17.02 | -11.34 | -1.36 | - | +3.70 | +10.82 | +15.14 |
| Level | Minor | Intermediate | Major | - | Intermediate | Minor | Major |
To determine price objectives, it is also possible to use the pivot points. Here is the price position in relation to pivot points:
| Pivot points | S3 | S2 | S1 | PP | R1 | R2 | R3 |
|---|---|---|---|---|---|---|---|
| Standard | 251.19 | 253.37 | 255.83 | 258.01 | 260.47 | 262.65 | 265.11 |
| Camarilla | 257.00 | 257.43 | 257.86 | 258.28 | 258.71 | 259.13 | 259.56 |
| Woodie | 251.32 | 253.44 | 255.96 | 258.08 | 260.60 | 262.72 | 265.24 |
| Fibonacci | 253.37 | 255.15 | 256.24 | 258.01 | 259.79 | 260.88 | 262.65 |
| Pivot points | S3 | S2 | S1 | PP | R1 | R2 | R3 |
|---|---|---|---|---|---|---|---|
| Standard | 237.69 | 242.57 | 250.43 | 255.31 | 263.17 | 268.05 | 275.91 |
| Camarilla | 254.78 | 255.94 | 257.11 | 258.28 | 259.45 | 260.62 | 261.78 |
| Woodie | 239.17 | 243.32 | 251.91 | 256.06 | 264.65 | 268.80 | 277.39 |
| Fibonacci | 242.57 | 247.44 | 250.45 | 255.31 | 260.18 | 263.19 | 268.05 |
| Pivot points | S3 | S2 | S1 | PP | R1 | R2 | R3 |
|---|---|---|---|---|---|---|---|
| Standard | 190.47 | 218.37 | 238.20 | 266.10 | 285.93 | 313.83 | 333.66 |
| Camarilla | 244.90 | 249.28 | 253.66 | 258.03 | 262.41 | 266.78 | 271.16 |
| Woodie | 186.44 | 216.35 | 234.17 | 264.08 | 281.90 | 311.81 | 329.63 |
| Fibonacci | 218.37 | 236.60 | 247.87 | 266.10 | 284.33 | 295.60 | 313.83 |
Numerical data
The following is the status of technical indicators and moving averages registered at the time this technical analysis was created:
| RSI (14): | 76.90 | |
| MACD (12,26,9): | 3.2800 | |
| Directional Movement: | 34.12 | |
| AROON (14): | 85.72 | |
| DEMA (21): | 261.85 | |
| Parabolic SAR (0,02-0,02-0,2): | 255.22 | |
| Elder Ray (13): | 7.51 | |
| Super Trend (3,10): | 258.15 | |
| Zig ZAG (10): | 267.03 | |
| VORTEX (21): | 1.2200 | |
| Stochastique (14,3,5): | 87.79 | |
| TEMA (21): | 263.66 | |
| Williams %R (14): | -16.69 | |
| Chande Momentum Oscillator (20): | 12.35 | |
| Repulse (5,40,3): | 2.2700 | |
| ROCnROLL: | 1 | |
| TRIX (15,9): | 0.1200 | |
| Courbe Coppock: | 7.51 |
| MA7: | 254.86 | |
| MA20: | 254.74 | |
| MA50: | 262.12 | |
| MA100: | 253.94 | |
| MAexp7: | 262.16 | |
| MAexp20: | 258.04 | |
| MAexp50: | 254.66 | |
| MAexp100: | 254.56 | |
| Price / MA7: | +4.46% | |
| Price / MA20: | +4.51% | |
| Price / MA50: | +1.56% | |
| Price / MA100: | +4.84% | |
| Price / MAexp7: | +1.55% | |
| Price / MAexp20: | +3.17% | |
| Price / MAexp50: | +4.54% | |
| Price / MAexp100: | +4.58% |
News
The last news published on WORKDAY INC. at the time of the generation of this analysis was as follows:
- Workday Co-Presidents Robynne Sisco and Doug Robinson to Present Virtually at Two Upcoming Investor Conferences
- Workday Announces Fiscal 2022 Third Quarter Financial Results
- Workday Announces Intent to Acquire VNDLY
- Workday Promotes Doug Robinson to Co-President and Barbara Larson to Chief Financial Officer
- Workday Delivers New Innovations to Elevate the Frontline Worker Experience
About author
Online


Add a comment
Comments
0 comments on the analysis WORKDAY INC. - 1H