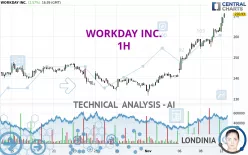
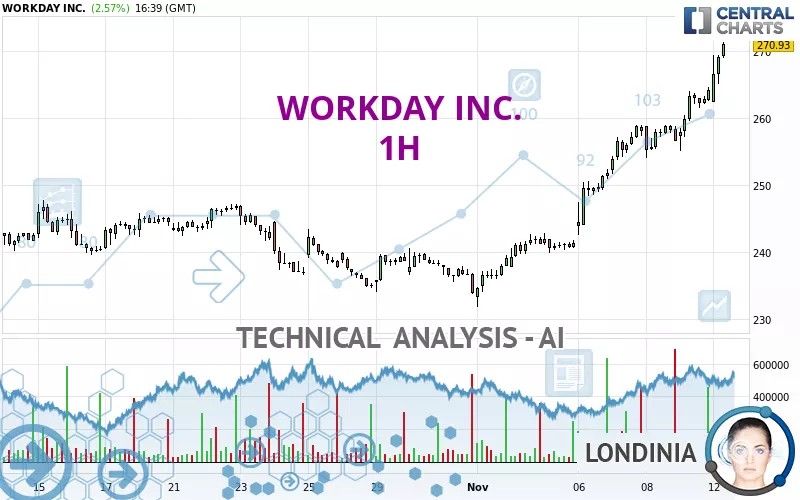
WORKDAY INC. - 1H - Technical analysis published on 11/12/2024 (GMT)
- 117
- 0
Click here for a new analysis!
- Timeframe : 1H
- - Analysis generated on
- Status : LEVEL MAINTAINED
Summary of the analysis

Additional analysis
Quotes
The WORKDAY INC. rating is 270.93 USD. On the day, this instrument gained +2.57% and was traded between 262.34 USD and 271.27 USD over the period. The price is currently at +3.27% from its lowest and -0.13% from its highest.The Central Gaps scanner detects a bearish opening marking the presence of sellers ahead of buyers at the opening but not sufficiently marked to allow the price to register a quotation gap.
Bearish opening
Type : Bearish
Timeframe : Openning
A study of price movements over other periods shows the following variations:
New HIGH record (1 month)
Type : Bullish
Timeframe : Weekly
Technical
A technical analysis in 1H of this WORKDAY INC. chart shows a strongly bullish trend. The signals given by the moving averages are 92.86% bullish. This strong bullish trend is confirmed by the strong signals currently being given by short-term moving averages. The Central Indicators scanner does not detect any result on moving averages that would impact this trend.
Technical indicators are strongly bullish, suggesting that the price increase should continue.
Caution: the Central Indicators scanner currently detects an excess:
RSI indicator is overbought : over 80
Type : Neutral
Timeframe : 1 hour
CCI indicator is overbought : over 100
Type : Neutral
Timeframe : 1 hour
Williams %R indicator is overbought : over -20
Type : Neutral
Timeframe : 1 hour
Pivot points : price is over resistance 1
Type : Neutral
Timeframe : Weekly
Pivot points : price is over resistance 2
Type : Neutral
Timeframe : 1 hour
An analysis of the price chart with the Central Patterns scanner (detector of chart patterns and resistances and supports) shows a result that can have an impact on the price change:
Resistance of channel is broken
Type : Bullish
Timeframe : 1 hour
The Central Candlesticks scanner, specialised in Japanese candlesticks, did not identify any signals.
| S3 | S2 | S1 | Price | R1 | R2 | |
|---|---|---|---|---|---|---|
| ProTrendLines | 256.00 | 258.88 | 264.95 | 270.93 | 281.36 | 300.90 |
| Change (%) | -5.51% | -4.45% | -2.21% | - | +3.85% | +11.06% |
| Change | -14.93 | -12.05 | -5.98 | - | +10.43 | +29.97 |
| Level | Minor | Minor | Major | - | Major | Major |
Attention could also be paid to pivot points to set price objectives:
| Pivot points | S3 | S2 | S1 | PP | R1 | R2 | R3 |
|---|---|---|---|---|---|---|---|
| Standard | 248.37 | 251.69 | 257.92 | 261.24 | 267.47 | 270.79 | 277.02 |
| Camarilla | 261.52 | 262.40 | 263.28 | 264.15 | 265.03 | 265.90 | 266.78 |
| Woodie | 249.83 | 252.42 | 259.38 | 261.97 | 268.93 | 271.52 | 278.48 |
| Fibonacci | 251.69 | 255.34 | 257.59 | 261.24 | 264.89 | 267.14 | 270.79 |
| Pivot points | S3 | S2 | S1 | PP | R1 | R2 | R3 |
|---|---|---|---|---|---|---|---|
| Standard | 222.14 | 229.95 | 243.25 | 251.06 | 264.36 | 272.17 | 285.47 |
| Camarilla | 250.74 | 252.67 | 254.61 | 256.54 | 258.48 | 260.41 | 262.35 |
| Woodie | 224.88 | 231.32 | 245.99 | 252.43 | 267.10 | 273.54 | 288.21 |
| Fibonacci | 229.95 | 238.02 | 243.00 | 251.06 | 259.13 | 264.11 | 272.17 |
| Pivot points | S3 | S2 | S1 | PP | R1 | R2 | R3 |
|---|---|---|---|---|---|---|---|
| Standard | 214.49 | 223.91 | 228.88 | 238.30 | 243.27 | 252.69 | 257.66 |
| Camarilla | 229.89 | 231.21 | 232.53 | 233.85 | 235.17 | 236.49 | 237.81 |
| Woodie | 212.27 | 222.80 | 226.66 | 237.19 | 241.05 | 251.58 | 255.44 |
| Fibonacci | 223.91 | 229.41 | 232.80 | 238.30 | 243.80 | 247.19 | 252.69 |
Numerical data
The following are the details of the technical indicators and moving averages that were collected to generate this technical analysis:
| RSI (14): | 80.74 | |
| MACD (12,26,9): | 4.6400 | |
| Directional Movement: | 29.81 | |
| AROON (14): | 64.29 | |
| DEMA (21): | 267.12 | |
| Parabolic SAR (0,02-0,02-0,2): | 258.99 | |
| Elder Ray (13): | 6.49 | |
| Super Trend (3,10): | 261.60 | |
| Zig ZAG (10): | 270.89 | |
| VORTEX (21): | 1.2800 | |
| Stochastique (14,3,5): | 92.00 | |
| TEMA (21): | 267.99 | |
| Williams %R (14): | -0.78 | |
| Chande Momentum Oscillator (20): | 11.96 | |
| Repulse (5,40,3): | 2.8400 | |
| ROCnROLL: | 1 | |
| TRIX (15,9): | 0.2400 | |
| Courbe Coppock: | 6.49 |
| MA7: | 254.83 | |
| MA20: | 245.08 | |
| MA50: | 245.94 | |
| MA100: | 237.68 | |
| MAexp7: | 266.20 | |
| MAexp20: | 260.77 | |
| MAexp50: | 253.59 | |
| MAexp100: | 248.52 | |
| Price / MA7: | +6.32% | |
| Price / MA20: | +10.55% | |
| Price / MA50: | +10.16% | |
| Price / MA100: | +13.99% | |
| Price / MAexp7: | +1.78% | |
| Price / MAexp20: | +3.90% | |
| Price / MAexp50: | +6.84% | |
| Price / MAexp100: | +9.02% |
News
The latest news and videos published on WORKDAY INC. at the time of the analysis were as follows:
- Workday Co-Presidents Robynne Sisco and Doug Robinson to Present Virtually at Two Upcoming Investor Conferences
- Workday Announces Intent to Acquire VNDLY
- Workday Announces Fiscal 2022 Third Quarter Financial Results
- Workday Promotes Doug Robinson to Co-President and Barbara Larson to Chief Financial Officer
- Workday Delivers New Innovations to Elevate the Frontline Worker Experience
About author
Online


Add a comment
Comments
0 comments on the analysis WORKDAY INC. - 1H