| Open: | 0.000021 |
| Change: | 0 |
| Volume: | 25 |
| Low: | 0.000020 |
| High: | 0.000021 |
| High / Low range: | 0.000001 |
| Type: | Stocks |
| Ticker: | WDAY |
| ISIN: |
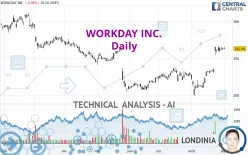
WORKDAY INC. - Daily - Technical analysis published on 09/03/2024 (GMT)
- 130
- 0
- 09/03/2024 - 15:35
Click here for a new analysis!
- Timeframe : Daily
- - Analysis generated on 09/03/2024 - 15:35
- Status : INVALID

Summary of the analysis

Additional analysis
Quotes
The WORKDAY INC. rating is 262.94 USD. On the day, this instrument lost -0.10% and was between 261.74 USD and 265.57 USD. This implies that the price is at +0.46% from its lowest and at -0.99% from its highest.The Central Gaps scanner detects a bearish opening. A small advantage for sellers in the very short term.
Bearish opening
Type : Bearish
Timeframe : Openning
So that you have an overall view of the price change, here is a table showing the variations over several periods:
Near a new HIGH record (1 month)
Type : Bullish
Timeframe : Weekly
Technical
A technical analysis in Daily of this WORKDAY INC. chart shows a bullish trend. The signals returned by the moving averages are 75.00% bullish. This bullish trend is reinforced by the strong signals currently being given by short-term moving averages. The Central Indicators market scanner currently does not detect any result that concerns moving averages.
An assessment of technical indicators shows a strong bullish signal.
But beware of excesses. The Central Indicators scanner currently detects this:
RSI indicator is overbought : over 70
Type : Neutral
Timeframe : Daily
CCI indicator is overbought : over 100
Type : Neutral
Timeframe : Daily
RSI indicator: bearish divergence
Type : Bearish
Timeframe : Daily
Williams %R indicator is overbought : over -20
Type : Neutral
Timeframe : Daily
The Central Patterns scanner, which studies chart patterns, resistances and supports, has identified this signal:
Near horizontal resistance
Type : Bearish
Timeframe : Daily
The Central Candlesticks scanner which studies Japanese candlesticks did not detect anything.
| S3 | S2 | S1 | Price | R1 | R2 | R3 | |
|---|---|---|---|---|---|---|---|
| ProTrendLines | 223.69 | 235.78 | 244.98 | 262.94 | 265.26 | 281.36 | 300.90 |
| Change (%) | -14.93% | -10.33% | -6.83% | - | +0.88% | +7.01% | +14.44% |
| Change | -39.25 | -27.16 | -17.96 | - | +2.32 | +18.42 | +37.96 |
| Level | Major | Intermediate | Minor | - | Major | Major | Major |
Pivot points can also be used to set your price objectives. Here is the price situation in relation to pivot points:
| Pivot points | S3 | S2 | S1 | PP | R1 | R2 | R3 |
|---|---|---|---|---|---|---|---|
| Standard | 256.79 | 258.57 | 260.88 | 262.66 | 264.97 | 266.75 | 269.06 |
| Camarilla | 262.07 | 262.44 | 262.82 | 263.19 | 263.57 | 263.94 | 264.32 |
| Woodie | 257.06 | 258.70 | 261.15 | 262.79 | 265.24 | 266.88 | 269.33 |
| Fibonacci | 258.57 | 260.13 | 261.10 | 262.66 | 264.22 | 265.19 | 266.75 |
| Pivot points | S3 | S2 | S1 | PP | R1 | R2 | R3 |
|---|---|---|---|---|---|---|---|
| Standard | 248.78 | 253.12 | 258.15 | 262.49 | 267.52 | 271.86 | 276.89 |
| Camarilla | 260.61 | 261.47 | 262.33 | 263.19 | 264.05 | 264.91 | 265.77 |
| Woodie | 249.14 | 253.29 | 258.51 | 262.66 | 267.88 | 272.03 | 277.25 |
| Fibonacci | 253.12 | 256.70 | 258.91 | 262.49 | 266.07 | 268.28 | 271.86 |
| Pivot points | S3 | S2 | S1 | PP | R1 | R2 | R3 |
|---|---|---|---|---|---|---|---|
| Standard | 152.72 | 176.26 | 219.73 | 243.27 | 286.74 | 310.28 | 353.75 |
| Camarilla | 244.76 | 250.91 | 257.05 | 263.19 | 269.33 | 275.48 | 281.62 |
| Woodie | 162.68 | 181.24 | 229.69 | 248.25 | 296.70 | 315.26 | 363.71 |
| Fibonacci | 176.26 | 201.86 | 217.68 | 243.27 | 268.87 | 284.69 | 310.28 |
Numerical data
The following is the status of technical indicators and moving averages registered at the time this technical analysis was created:
| RSI (14): | 75.55 | |
| MACD (12,26,9): | 11.2600 | |
| Directional Movement: | 27.95 | |
| AROON (14): | 71.43 | |
| DEMA (21): | 256.62 | |
| Parabolic SAR (0,02-0,02-0,2): | 247.02 | |
| Elder Ray (13): | 13.35 | |
| Super Trend (3,10): | 242.85 | |
| Zig ZAG (10): | 264.98 | |
| VORTEX (21): | 1.1300 | |
| Stochastique (14,3,5): | 93.90 | |
| TEMA (21): | 265.54 | |
| Williams %R (14): | -4.28 | |
| Chande Momentum Oscillator (20): | 33.09 | |
| Repulse (5,40,3): | 0.9200 | |
| ROCnROLL: | 1 | |
| TRIX (15,9): | 0.4700 | |
| Courbe Coppock: | 39.59 |
| MA7: | 262.24 | |
| MA20: | 236.22 | |
| MA50: | 229.50 | |
| MA100: | 233.86 | |
| MAexp7: | 258.47 | |
| MAexp20: | 243.88 | |
| MAexp50: | 234.96 | |
| MAexp100: | 237.27 | |
| Price / MA7: | +0.27% | |
| Price / MA20: | +11.31% | |
| Price / MA50: | +14.57% | |
| Price / MA100: | +12.43% | |
| Price / MAexp7: | +1.73% | |
| Price / MAexp20: | +7.82% | |
| Price / MAexp50: | +11.91% | |
| Price / MAexp100: | +10.82% |
News
The last news published on WORKDAY INC. at the time of the generation of this analysis was as follows:
- 11/23/2021 - 13:30 Workday Co-Presidents Robynne Sisco and Doug Robinson to Present Virtually at Two Upcoming Investor Conferences
- 11/18/2021 - 21:01 Workday Announces Intent to Acquire VNDLY
- 11/18/2021 - 21:01 Workday Announces Fiscal 2022 Third Quarter Financial Results
- 11/18/2021 - 21:01 Workday Promotes Doug Robinson to Co-President and Barbara Larson to Chief Financial Officer
- 11/10/2021 - 14:00 Workday Delivers New Innovations to Elevate the Frontline Worker Experience
About author
Online


Add a comment
Comments
0 comments on the analysis WORKDAY INC. - Daily