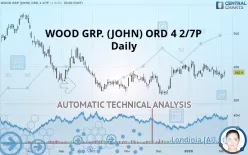
WOOD GRP. (JOHN) ORD 4 2/7P - Daily - Technical analysis published on 02/06/2020 (GMT)
- 443
- 0
- Who voted?
- Timeframe : Daily
- - Analysis generated on
- Status : NEUTRAL

Summary of the analysis

Additional analysis
Quotes
The WOOD GRP. (JOHN) ORD 4 2/7P rating is 382.9 GBX. The price has increased by +1.81% since the last closing and was between 370.4 GBX and 388.4 GBX. This implies that the price is at +3.37% from its lowest and at -1.42% from its highest.A bullish opening was detected by the Central Gaps scanner. Buyers are trying to impose a bullish momentum in the very short term.
Bullish opening
Type : Bullish
Timeframe : Openning
So that you have an overall view of the price change, here is a table showing the variations over several periods:
Near a new LOW record (1st january)
Type : Bearish
Timeframe : Weekly
Near a new LOW record (1 month)
Type : Bearish
Timeframe : Weekly
Technical
A technical analysis in Daily of this WOOD GRP. (JOHN) ORD 4 2/7P chart shows a slightly bearish trend. Only 50% of the signals given by moving averages are bearish. This slightly bearish trend could return to neutral given the neutral signals also given by short-term moving averages. An assessment of moving averages reveals several bearish signals that could impact this trend:
Bearish price crossover with Moving Average 50
Type : Bearish
Timeframe : Daily
Bearish price crossover with Moving Average 100
Type : Bearish
Timeframe : Daily
Bearish price crossover with adaptative moving average 20
Type : Bearish
Timeframe : Daily
Bearish price crossover with adaptative moving average 50
Type : Bearish
Timeframe : Daily
In fact, according to the parameters integrated into the Central Analyzer system, only 9 technical indicators out of 18 analysed are currently bearish. But beware of excesses. The Central Indicators scanner currently detects this:
CCI indicator is oversold : under -100
Type : Neutral
Timeframe : Daily
Williams %R indicator is oversold : under -80
Type : Neutral
Timeframe : Daily
Pivot points : price is over resistance 1
Type : Neutral
Timeframe : Daily
Pivot points : price is under support 1
Type : Neutral
Timeframe : Weekly
Pivot points : price is under support 3
Type : Neutral
Timeframe : Daily
Parabolic SAR indicator bearish reversal
Type : Bearish
Timeframe : Daily
Aroon indicator bearish trend
Type : Bearish
Timeframe : Daily
MACD indicator is back under 0
Type : Bearish
Timeframe : Daily
Momentum indicator is back under 0
Type : Bearish
Timeframe : Daily
The Central Patterns scanner, which studies chart patterns, resistances and supports, has identified this signal:
Near support of channel
Type : Bullish
Timeframe : Daily
The Central Candlesticks scanner, specialised in Japanese candlesticks, did not identify any signals.
| S3 | S2 | S1 | Price | R1 | R2 | R3 | |
|---|---|---|---|---|---|---|---|
| ProTrendLines | 327.4 | 351.0 | 370.6 | 382.9 | 404.2 | 451.3 | 491.9 |
| Change (%) | -14.49% | -8.33% | -3.21% | - | +5.56% | +17.86% | +28.47% |
| Change | -55.5 | -31.9 | -12.3 | - | +21.3 | +68.4 | +109.0 |
| Level | Minor | Intermediate | Major | - | Intermediate | Minor | Major |
Attention could also be paid to pivot points to set price objectives:
| Pivot points | S3 | S2 | S1 | PP | R1 | R2 | R3 |
|---|---|---|---|---|---|---|---|
| Standard | 343.2 | 353.0 | 358.8 | 368.6 | 374.4 | 384.2 | 390.0 |
| Camarilla | 360.2 | 361.6 | 363.1 | 364.5 | 365.9 | 367.4 | 368.8 |
| Woodie | 341.1 | 352.0 | 356.7 | 367.6 | 372.3 | 383.2 | 387.9 |
| Fibonacci | 353.0 | 359.0 | 362.7 | 368.6 | 374.6 | 378.3 | 384.2 |
| Pivot points | S3 | S2 | S1 | PP | R1 | R2 | R3 |
|---|---|---|---|---|---|---|---|
| Standard | 361.7 | 373.2 | 382.1 | 393.6 | 402.5 | 414.0 | 422.9 |
| Camarilla | 385.4 | 387.3 | 389.1 | 391.0 | 392.9 | 394.7 | 396.6 |
| Woodie | 360.4 | 372.6 | 380.8 | 393.0 | 401.2 | 413.4 | 421.6 |
| Fibonacci | 373.2 | 381.0 | 385.8 | 393.6 | 401.4 | 406.2 | 414.0 |
| Pivot points | S3 | S2 | S1 | PP | R1 | R2 | R3 |
|---|---|---|---|---|---|---|---|
| Standard | 299.3 | 331.4 | 353.9 | 386.0 | 408.5 | 440.6 | 463.1 |
| Camarilla | 361.3 | 366.3 | 371.3 | 376.3 | 381.3 | 386.3 | 391.3 |
| Woodie | 294.4 | 329.0 | 349.0 | 383.6 | 403.6 | 438.2 | 458.2 |
| Fibonacci | 331.4 | 352.3 | 365.2 | 386.0 | 406.9 | 419.8 | 440.6 |
Numerical data
The following are the details of the technical indicators and moving averages that were collected to generate this technical analysis:
| RSI (14): | 47.50 | |
| MACD (12,26,9): | -1.1000 | |
| Directional Movement: | -2.5 | |
| AROON (14): | -85.8 | |
| DEMA (21): | 382.7 | |
| Parabolic SAR (0,02-0,02-0,2): | 409.0 | |
| Elder Ray (13): | -7.8 | |
| Super Trend (3,10): | 360.3 | |
| Zig ZAG (10): | 376.1 | |
| VORTEX (21): | 0.9000 | |
| Stochastique (14,3,5): | 16.40 | |
| TEMA (21): | 377.2 | |
| Williams %R (14): | -71.90 | |
| Chande Momentum Oscillator (20): | -17.1 | |
| Repulse (5,40,3): | -1.8000 | |
| ROCnROLL: | 2 | |
| TRIX (15,9): | 0.1000 | |
| Courbe Coppock: | 3.00 |
| MA7: | 378.3 | |
| MA20: | 383.4 | |
| MA50: | 374.7 | |
| MA100: | 371.2 | |
| MAexp7: | 377.8 | |
| MAexp20: | 382.3 | |
| MAexp50: | 379.1 | |
| MAexp100: | 385.2 | |
| Price / MA7: | +1.22% | |
| Price / MA20: | -0.13% | |
| Price / MA50: | +2.19% | |
| Price / MA100: | +3.15% | |
| Price / MAexp7: | +1.35% | |
| Price / MAexp20: | +0.16% | |
| Price / MAexp50: | +1.00% | |
| Price / MAexp100: | -0.60% |
News
Don"t forget to follow the news on WOOD GRP. (JOHN) ORD 4 2/7P. At the time of publication of this analysis, the latest news was as follows:
- Dimensional Fund Advisors Ltd. : Form 8.3 - John Wood Group Plc - Ordinary shares
- Dimensional Fund Advisors Ltd. : Form 8.3 - John Wood Group Plc - Ordinary shares
- Dimensional Fund Advisors Ltd. : Form 8.3 - John Wood Group Plc - Ordinary shares
- Dimensional Fund Advisors Ltd. : Form 8.3 - John Wood Group Plc - Ordinary shares
- Dimensional Fund Advisors Ltd. : Form 8.3 - John Wood Group Plc - Ordinary shares
About author

Online


Add a comment
Comments
0 comments on the analysis WOOD GRP. (JOHN) ORD 4 2/7P - Daily