SIKA N overview
SIKA N
> Analyses

 Thank you
Reply
Chart
Thank you
Reply
Chart
Londinia
has published a new analysis.
- 0
- 91975
- 15661
- 0
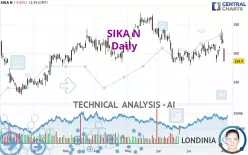
Timeframe : 1H - Simple chart
Status : INVALID
The bullish trend is currently very strong on SIKA N. As long as the price remains above the support at 239.2 CHF, you could try to benefit from the boom. The first bullish objective is located at…
SIKA N
> Analyses
 Thank you
Reply
Chart
Thank you
Reply
Chart
Londinia
has published a new analysis.
- 0
- 91975
- 15661
- 0
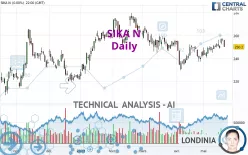
Timeframe : Daily - Simple chart
Status : TARGET REACHED
The strong short-term increase of SIKA N should quickly allow the basic trend to become bullish. As long as the price remains above the support located at 226.6 CHF, a purchase could be considered.…
SIKA N
> Analyses
 Thank you
Reply
Chart
Thank you
Reply
Chart
Londinia
has published a new analysis.
- 0
- 91975
- 15661
- 0
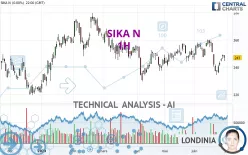
Timeframe : 1H - Simple chart
Status : TARGET REACHED
SIKA N is part of a very strong bullish trend. Traders may consider trading only long positions (at the time of purchase) as long as the price remains well above 247.4250 CHF. The next resistance…
SIKA N
> Analyses
 Thank you
Reply
Chart
Thank you
Reply
Chart
Londinia
has published a new analysis.
- 0
- 91975
- 15661
- 0
Timeframe : Daily - Simple chart
Status : INVALID
There is a bearish trend on SIKA N both at the basic level and in the short term. A sale could be considered, so long as the price remains below 258.0000 CHF. Each support break is a strong signal…
SIKA N
> Analyses
 Thank you
Reply
Chart
Thank you
Reply
Chart
Londinia
has published a new analysis for Vincent Launay.
- 0
- 91975
- 15661
- 0
Timeframe : Daily - Simple chart
Status : NEUTRAL
The basic trend is slightly bearish and the short term is tentatively bullish. With such a pattern, it is difficult to favour buying or selling. The first resistance is located at 148.90 CHF. The…

