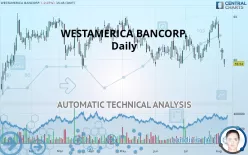
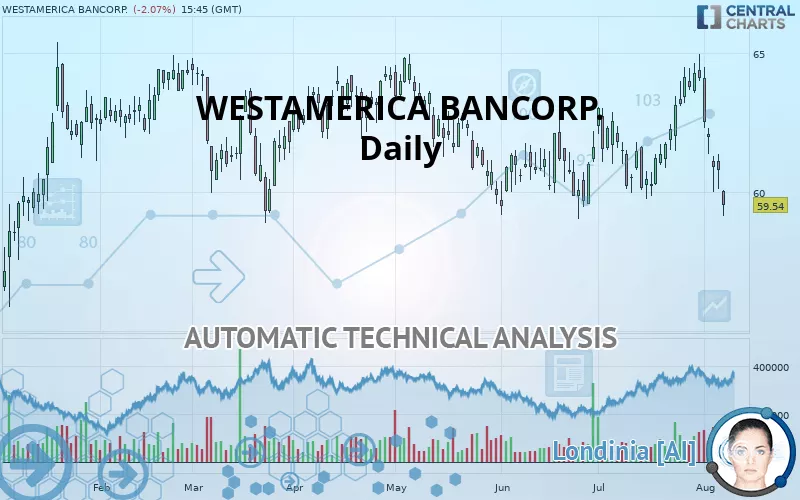
WESTAMERICA BANCORP. - Daily - Technical analysis published on 08/07/2019 (GMT)
- 204
- 0
- Who voted?
Click here for a new analysis!
- Timeframe : Daily
- - Analysis generated on
- Status : INVALID
Summary of the analysis

Additional analysis
Quotes
WESTAMERICA BANCORP. rating 59.54 USD. The price is lower by -2.07% since the last closing and was between 59.15 USD and 60.08 USD. This implies that the price is at +0.66% from its lowest and at -0.90% from its highest.The Central Gaps scanner detects the formation of a bearish gap marking the strong presence of sellers ahead of buyers at the opening. This formed a quotation gap.
Opening Gap DOWN
Type : Bearish
Timeframe : Openning
So that you have an overall view of the price change, here is a table showing the variations over several periods:
Technical
Technical analysis of WESTAMERICA BANCORP. in Daily shows an overall bearish trend. The signals given by moving averages are 78.57% bearish. This bearish trend is reinforced by the strong signals currently being given by short-term moving averages. The Central Indicators scanner does not detect any result on moving averages that would impact this trend.
In fact, 13 technical indicators on 18 studied are currently positioned bearish. Caution: the Central Indicators scanner currently detects an excess:
Williams %R indicator is oversold : under -80
Type : Neutral
Timeframe : Daily
Pivot points : price is under support 1
Type : Neutral
Timeframe : Weekly
Pivot points : price is under support 2
Type : Neutral
Timeframe : Daily
Ichimoku : price is under the cloud
Type : Bearish
Timeframe : Daily
Central Patterns, the market scanner focusing on chart patterns, resistances and supports found these results:
Horizontal support is broken
Type : Bearish
Timeframe : Daily
Support of channel is broken
Type : Bearish
Timeframe : Daily
The Central Candlesticks scanner, specialised in Japanese candlesticks, did not identify any signals.
| S3 | S2 | S1 | Price | R1 | R2 | R3 | |
|---|---|---|---|---|---|---|---|
| ProTrendLines | 54.50 | 57.16 | 59.42 | 59.54 | 60.75 | 62.19 | 63.11 |
| Change (%) | -8.46% | -4.00% | -0.20% | - | +2.03% | +4.45% | +6.00% |
| Change | -5.04 | -2.38 | -0.12 | - | +1.21 | +2.65 | +3.57 |
| Level | Minor | Intermediate | Major | - | Intermediate | Minor | Major |
To determine price objectives, it is also possible to use the pivot points. Here is the price position in relation to pivot points:
| Pivot points | S3 | S2 | S1 | PP | R1 | R2 | R3 |
|---|---|---|---|---|---|---|---|
| Standard | 58.93 | 59.53 | 60.16 | 60.76 | 61.39 | 61.99 | 62.62 |
| Camarilla | 60.46 | 60.57 | 60.69 | 60.80 | 60.91 | 61.03 | 61.14 |
| Woodie | 58.96 | 59.54 | 60.19 | 60.77 | 61.42 | 62.00 | 62.65 |
| Fibonacci | 59.53 | 60.00 | 60.29 | 60.76 | 61.23 | 61.52 | 61.99 |
| Pivot points | S3 | S2 | S1 | PP | R1 | R2 | R3 |
|---|---|---|---|---|---|---|---|
| Standard | 56.99 | 59.17 | 60.58 | 62.76 | 64.17 | 66.35 | 67.76 |
| Camarilla | 60.99 | 61.32 | 61.65 | 61.98 | 62.31 | 62.64 | 62.97 |
| Woodie | 56.60 | 58.98 | 60.19 | 62.57 | 63.78 | 66.16 | 67.37 |
| Fibonacci | 59.17 | 60.55 | 61.39 | 62.76 | 64.14 | 64.98 | 66.35 |
| Pivot points | S3 | S2 | S1 | PP | R1 | R2 | R3 |
|---|---|---|---|---|---|---|---|
| Standard | 55.73 | 57.75 | 60.92 | 62.94 | 66.11 | 68.13 | 71.30 |
| Camarilla | 62.67 | 63.15 | 63.62 | 64.10 | 64.58 | 65.05 | 65.53 |
| Woodie | 56.32 | 58.04 | 61.51 | 63.23 | 66.70 | 68.42 | 71.89 |
| Fibonacci | 57.75 | 59.73 | 60.95 | 62.94 | 64.92 | 66.14 | 68.13 |
Numerical data
The following is the status of technical indicators and moving averages registered at the time this technical analysis was created:
| RSI (14): | 36.32 | |
| MACD (12,26,9): | -0.0600 | |
| Directional Movement: | -13.39 | |
| AROON (14): | -35.71 | |
| DEMA (21): | 61.91 | |
| Parabolic SAR (0,02-0,02-0,2): | 64.50 | |
| Elder Ray (13): | -2.19 | |
| Super Trend (3,10): | 63.58 | |
| Zig ZAG (10): | 59.53 | |
| VORTEX (21): | 0.8600 | |
| Stochastique (14,3,5): | 14.35 | |
| TEMA (21): | 61.75 | |
| Williams %R (14): | -94.31 | |
| Chande Momentum Oscillator (20): | -2.24 | |
| Repulse (5,40,3): | -1.5400 | |
| ROCnROLL: | 2 | |
| TRIX (15,9): | 0.0800 | |
| Courbe Coppock: | 2.58 |
| MA7: | 62.01 | |
| MA20: | 61.89 | |
| MA50: | 61.36 | |
| MA100: | 62.03 | |
| MAexp7: | 61.39 | |
| MAexp20: | 61.86 | |
| MAexp50: | 61.77 | |
| MAexp100: | 61.77 | |
| Price / MA7: | -3.98% | |
| Price / MA20: | -3.80% | |
| Price / MA50: | -2.97% | |
| Price / MA100: | -4.01% | |
| Price / MAexp7: | -3.01% | |
| Price / MAexp20: | -3.75% | |
| Price / MAexp50: | -3.61% | |
| Price / MAexp100: | -3.61% |
News
The last news published on WESTAMERICA BANCORP. at the time of the generation of this analysis was as follows:
-
 Westamerica Bancorp
- Westamerica Bancorporation Declares Quarterly Cash Dividend
- Westamerica Bancorporation Reports Fourth Quarter 2016 Financial Results
-
Westamerica Bancorp
- Westamerica Bancorporation Declares Quarterly Cash Dividend
About author

Online


Add a comment
Comments
0 comments on the analysis WESTAMERICA BANCORP. - Daily