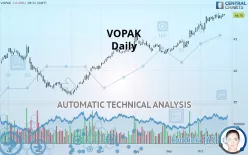
VOPAK - Daily - Technical analysis published on 10/23/2019 (GMT)
- 335
- 0
- Who voted?
Click here for a new analysis!
- Timeframe : Daily
- - Analysis generated on
- Status : TARGET REACHED

Summary of the analysis

Additional analysis
Quotes
The VOPAK price is 48.76 EUR. The price is lower by -0.21% since the last closing and was between 48.69 EUR and 48.93 EUR. This implies that the price is at +0.14% from its lowest and at -0.35% from its highest.The Central Gaps scanner detects a bullish opening marking the presence of buyers ahead of sellers at the opening but not sufficiently marked to allow the price to register a quotation gap.
Bullish opening
Type : Bullish
Timeframe : Openning
A study of price movements over other periods shows the following variations:
Near a new HIGH record (5 years)
Type : Bullish
Timeframe : Weekly
Near a new HIGH record (1st january)
Type : Bullish
Timeframe : Weekly
Near a new HIGH record (1 month)
Type : Bullish
Timeframe : Weekly
Technical
A technical analysis in Daily of this VOPAK chart shows a strongly bullish trend. 92.86% of the signals given by moving averages are bullish. The overall trend is supported by the strong bullish signals from short-term moving averages. The Central Indicators scanner does not detect any result on moving averages that would impact this trend.
In fact, 11 technical indicators on 18 studied are currently bullish. Caution: the Central Indicators scanner currently detects an excess:
Williams %R indicator is overbought : over -20
Type : Neutral
Timeframe : Daily
Price is back over the pivot point
Type : Bullish
Timeframe : Daily
An analysis of the price chart with the Central Patterns scanner (detector of chart patterns and resistances and supports) shows a result that can have an impact on the price change:
Near resistance of channel
Type : Bearish
Timeframe : Daily
The Central Candlesticks scanner, specialised in Japanese candlesticks, did not identify any signals.
| S3 | S2 | S1 | Price | R1 | R2 | |
|---|---|---|---|---|---|---|
| ProTrendLines | 42.91 | 45.10 | 46.23 | 48.76 | 48.88 | 57.94 |
| Change (%) | -12.00% | -7.51% | -5.19% | - | +0.25% | +18.83% |
| Change | -5.85 | -3.66 | -2.53 | - | +0.12 | +9.18 |
| Level | Major | Major | Major | - | Major | Intermediate |
Attention could also be paid to pivot points to set price objectives:
| Pivot points | S3 | S2 | S1 | PP | R1 | R2 | R3 |
|---|---|---|---|---|---|---|---|
| Standard | 48.10 | 48.31 | 48.58 | 48.79 | 49.06 | 49.27 | 49.54 |
| Camarilla | 48.73 | 48.77 | 48.82 | 48.86 | 48.90 | 48.95 | 48.99 |
| Woodie | 48.14 | 48.33 | 48.62 | 48.81 | 49.10 | 49.29 | 49.58 |
| Fibonacci | 48.31 | 48.49 | 48.60 | 48.79 | 48.97 | 49.08 | 49.27 |
| Pivot points | S3 | S2 | S1 | PP | R1 | R2 | R3 |
|---|---|---|---|---|---|---|---|
| Standard | 46.48 | 47.15 | 47.73 | 48.40 | 48.98 | 49.65 | 50.23 |
| Camarilla | 47.96 | 48.07 | 48.19 | 48.30 | 48.42 | 48.53 | 48.64 |
| Woodie | 46.43 | 47.13 | 47.68 | 48.38 | 48.93 | 49.63 | 50.18 |
| Fibonacci | 47.15 | 47.63 | 47.93 | 48.40 | 48.88 | 49.18 | 49.65 |
| Pivot points | S3 | S2 | S1 | PP | R1 | R2 | R3 |
|---|---|---|---|---|---|---|---|
| Standard | 39.60 | 41.23 | 44.20 | 45.83 | 48.80 | 50.43 | 53.40 |
| Camarilla | 45.90 | 46.32 | 46.74 | 47.16 | 47.58 | 48.00 | 48.43 |
| Woodie | 40.26 | 41.57 | 44.86 | 46.17 | 49.46 | 50.77 | 54.06 |
| Fibonacci | 41.23 | 42.99 | 44.08 | 45.83 | 47.59 | 48.68 | 50.43 |
Numerical data
The following is the status of technical indicators and moving averages registered at the time this technical analysis was created:
| RSI (14): | 66.31 | |
| MACD (12,26,9): | 0.9300 | |
| Directional Movement: | 18.04 | |
| AROON (14): | 71.43 | |
| DEMA (21): | 49.05 | |
| Parabolic SAR (0,02-0,02-0,2): | 48.21 | |
| Elder Ray (13): | 0.56 | |
| Super Trend (3,10): | 46.88 | |
| Zig ZAG (10): | 48.79 | |
| VORTEX (21): | 1.1900 | |
| Stochastique (14,3,5): | 89.02 | |
| TEMA (21): | 49.19 | |
| Williams %R (14): | -10.27 | |
| Chande Momentum Oscillator (20): | 0.28 | |
| Repulse (5,40,3): | 0.7500 | |
| ROCnROLL: | 1 | |
| TRIX (15,9): | 0.3200 | |
| Courbe Coppock: | 6.94 |
| MA7: | 48.64 | |
| MA20: | 47.91 | |
| MA50: | 45.55 | |
| MA100: | 43.71 | |
| MAexp7: | 48.58 | |
| MAexp20: | 47.77 | |
| MAexp50: | 46.09 | |
| MAexp100: | 44.40 | |
| Price / MA7: | +0.25% | |
| Price / MA20: | +1.77% | |
| Price / MA50: | +7.05% | |
| Price / MA100: | +11.55% | |
| Price / MAexp7: | +0.35% | |
| Price / MAexp20: | +2.05% | |
| Price / MAexp50: | +5.77% | |
| Price / MAexp100: | +9.80% |
News
The latest news and videos published on VOPAK at the time of the analysis were as follows:
- Royal Vopak: Update divestment terminal in Algeciras
- Vopak completes divestment of terminals in Amsterdam and Hamburg
- Vopak reports on HY1 2019
- Resolutions passed by Vopak's Annual General Meeting
- Royal Vopak: Interim Update Q1 2019
About author

Online


Add a comment
Comments
0 comments on the analysis VOPAK - Daily