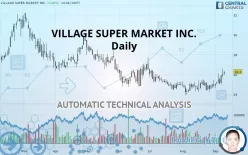
VILLAGE SUPER MARKET INC. - Daily - Technical analysis published on 09/11/2019 (GMT)
- 146
- 0
- Who voted?
Click here for a new analysis!
- Timeframe : Daily
- - Analysis generated on
- Status : TARGET REACHED

Summary of the analysis

Additional analysis
Quotes
The VILLAGE SUPER MARKET INC. price is 26.30 USD. The price registered an increase of +0.81% on the session with the lowest point at 25.93 USD and the highest point at 26.30 USD. The deviation from the price is +1.43% for the low point and 0% for the high point.The Central Gaps scanner detects a bullish opening. A small advantage for buyers in the very short term.
Bullish opening
Type : Bullish
Timeframe : Openning
So that you have an overall view of the price change, here is a table showing the variations over several periods:
Near a new HIGH record (1 month)
Type : Bullish
Timeframe : Weekly
Technical
A technical analysis in Daily of this VILLAGE SUPER MARKET INC. chart shows a slightly bullish trend. 60.71% of the signals given by moving averages are bullish. The overall trend could accelerate as strong bullish signals from short-term moving averages are expected. The Central Indicators market scanner is currently detecting a bullish signal that could impact this trend:
Bullish price crossover with adaptative moving average 50
Type : Bullish
Timeframe : Daily
In fact, 17 technical indicators on 18 studied are currently positioned bullish. Caution: the Central Indicators scanner currently detects an excess:
CCI indicator is overbought : over 100
Type : Neutral
Timeframe : Daily
Previous candle closed over Bollinger bands
Type : Neutral
Timeframe : Daily
Williams %R indicator is overbought : over -20
Type : Neutral
Timeframe : Daily
Pivot points : price is over resistance 1
Type : Neutral
Timeframe : Weekly
SuperTrend indicator bullish reversal
Type : Bullish
Timeframe : Daily
An analysis of the price chart with the Central Patterns scanner (detector of chart patterns and resistances and supports) shows a result that can have an impact on the price change:
Near resistance of channel
Type : Bearish
Timeframe : Daily
The Central Candlesticks scanner, specialised in Japanese candlesticks, did not identify any signals.
| S3 | S2 | S1 | Price | R1 | R2 | R3 | |
|---|---|---|---|---|---|---|---|
| ProTrendLines | 23.76 | 24.45 | 25.15 | 26.30 | 26.76 | 28.05 | 29.88 |
| Change (%) | -9.66% | -7.03% | -4.37% | - | +1.75% | +6.65% | +13.61% |
| Change | -2.54 | -1.85 | -1.15 | - | +0.46 | +1.75 | +3.58 |
| Level | Major | Minor | Major | - | Intermediate | Major | Major |
To determine price objectives, it is also possible to use the pivot points. Here is the price position in relation to pivot points:
| Pivot points | S3 | S2 | S1 | PP | R1 | R2 | R3 |
|---|---|---|---|---|---|---|---|
| Standard | 24.74 | 25.23 | 25.66 | 26.14 | 26.57 | 27.06 | 27.49 |
| Camarilla | 25.84 | 25.92 | 26.01 | 26.09 | 26.17 | 26.26 | 26.34 |
| Woodie | 24.72 | 25.21 | 25.63 | 26.13 | 26.55 | 27.04 | 27.46 |
| Fibonacci | 25.23 | 25.58 | 25.79 | 26.14 | 26.49 | 26.71 | 27.06 |
| Pivot points | S3 | S2 | S1 | PP | R1 | R2 | R3 |
|---|---|---|---|---|---|---|---|
| Standard | 23.03 | 23.85 | 24.49 | 25.31 | 25.95 | 26.77 | 27.41 |
| Camarilla | 24.73 | 24.86 | 25.00 | 25.13 | 25.26 | 25.40 | 25.53 |
| Woodie | 22.94 | 23.81 | 24.40 | 25.27 | 25.86 | 26.73 | 27.32 |
| Fibonacci | 23.85 | 24.41 | 24.75 | 25.31 | 25.87 | 26.21 | 26.77 |
| Pivot points | S3 | S2 | S1 | PP | R1 | R2 | R3 |
|---|---|---|---|---|---|---|---|
| Standard | 22.54 | 23.23 | 24.10 | 24.79 | 25.66 | 26.35 | 27.22 |
| Camarilla | 24.54 | 24.68 | 24.83 | 24.97 | 25.11 | 25.26 | 25.40 |
| Woodie | 22.63 | 23.28 | 24.19 | 24.84 | 25.75 | 26.40 | 27.31 |
| Fibonacci | 23.23 | 23.83 | 24.19 | 24.79 | 25.39 | 25.75 | 26.35 |
Numerical data
The following is the status of technical indicators and moving averages registered at the time this technical analysis was created:
| RSI (14): | 66.06 | |
| MACD (12,26,9): | 0.2300 | |
| Directional Movement: | 17.62 | |
| AROON (14): | 64.29 | |
| DEMA (21): | 25.49 | |
| Parabolic SAR (0,02-0,02-0,2): | 24.61 | |
| Elder Ray (13): | 0.70 | |
| Super Trend (3,10): | 24.21 | |
| Zig ZAG (10): | 26.30 | |
| VORTEX (21): | 1.0900 | |
| Stochastique (14,3,5): | 84.73 | |
| TEMA (21): | 25.83 | |
| Williams %R (14): | -13.39 | |
| Chande Momentum Oscillator (20): | 1.86 | |
| Repulse (5,40,3): | 2.5000 | |
| ROCnROLL: | 1 | |
| TRIX (15,9): | 0.0300 | |
| Courbe Coppock: | 6.02 |
| MA7: | 25.58 | |
| MA20: | 25.09 | |
| MA50: | 25.10 | |
| MA100: | 26.08 | |
| MAexp7: | 25.70 | |
| MAexp20: | 25.27 | |
| MAexp50: | 25.34 | |
| MAexp100: | 25.87 | |
| Price / MA7: | +2.81% | |
| Price / MA20: | +4.82% | |
| Price / MA50: | +4.78% | |
| Price / MA100: | +0.84% | |
| Price / MAexp7: | +2.33% | |
| Price / MAexp20: | +4.08% | |
| Price / MAexp50: | +3.79% | |
| Price / MAexp100: | +1.66% |
News
The last news published on VILLAGE SUPER MARKET INC. at the time of the generation of this analysis was as follows:
-
 Village Super Market
- Village Super Market, Inc. Declares Quarterly Dividend
- Village Super Market, Inc. Reports Results for the First Quarter Ended October 29, 2016
- Village Super Market, Inc. Reports Results for the Fourth Quarter Ended July 30, 2016
About author

Online


Add a comment
Comments
0 comments on the analysis VILLAGE SUPER MARKET INC. - Daily