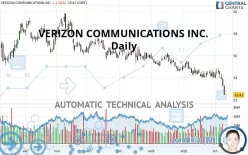
VERIZON COMMUNICATIONS INC. - Daily - Technical analysis published on 10/11/2021 (GMT)
- 296
- 0
Click here for a new analysis!
- Timeframe : Daily
- - Analysis generated on
- Status : TARGET REACHED

Summary of the analysis

Additional analysis
Quotes
The VERIZON COMMUNICATIONS INC. price is 52.42 USD. The price is lower by -1.54% since the last closing and was between 52.41 USD and 53.29 USD. This implies that the price is at +0.02% from its lowest and at -1.63% from its highest.The Central Gaps scanner detects a bullish opening marking the presence of buyers ahead of sellers at the opening but not sufficiently marked to allow the price to register a quotation gap.
Bullish opening
Type : Bullish
Timeframe : Openning
Here is a more detailed summary of the historical variations registered by VERIZON COMMUNICATIONS INC.:
New LOW record (1 year)
Type : Bearish
Timeframe : Weekly
New LOW record (1st january)
Type : Bearish
Timeframe : Weekly
Near a new HIGH record (1 month)
Type : Bullish
Timeframe : Weekly
New LOW record (1 month)
Type : Bearish
Timeframe : Weekly
Technical
Technical analysis of this Daily chart of VERIZON COMMUNICATIONS INC. indicates that the overall trend is strongly bearish. 92.86% of the signals given by moving averages are bearish. This strongly bearish trend is supported by the strong bearish signals given by short-term moving averages. The Central Indicators market scanner is currently detecting a bearish signal that could impact this trend:
Moving Average bearish crossovers : AMA50 & AMA100
Type : Bearish
Timeframe : Daily
In fact, of the 18 technical indicators analysed by Central Analyzer, 4 are bullish, 3 are neutral and 11 are bearish. Caution: the Central Indicators scanner currently detects an excess:
CCI indicator is oversold : under -100
Type : Neutral
Timeframe : Daily
Williams %R indicator is oversold : under -80
Type : Neutral
Timeframe : Daily
Pivot points : price is under support 1
Type : Neutral
Timeframe : Weekly
Pivot points : price is under support 3
Type : Neutral
Timeframe : Daily
MACD crosses DOWN its Moving Average
Type : Bearish
Timeframe : Daily
Central Patterns, the market scanner focusing on chart patterns, resistances and supports found these results:
Near horizontal support
Type : Bullish
Timeframe : Daily
Support of channel is broken
Type : Bearish
Timeframe : Daily
No result was found by the Central Candlesticks scanner on Japanese candlesticks.
| S3 | S2 | S1 | Price | R1 | R2 | R3 | |
|---|---|---|---|---|---|---|---|
| ProTrendLines | 46.05 | 49.94 | 51.57 | 52.42 | 54.03 | 55.43 | 56.31 |
| Change (%) | -12.15% | -4.73% | -1.62% | - | +3.07% | +5.74% | +7.42% |
| Change | -6.37 | -2.48 | -0.85 | - | +1.61 | +3.01 | +3.89 |
| Level | Major | Intermediate | Minor | - | Major | Intermediate | Minor |
To determine price objectives, it is also possible to use the pivot points. Here is the price position in relation to pivot points:
| Pivot points | S3 | S2 | S1 | PP | R1 | R2 | R3 |
|---|---|---|---|---|---|---|---|
| Standard | 52.27 | 52.75 | 53.00 | 53.48 | 53.73 | 54.21 | 54.46 |
| Camarilla | 53.04 | 53.11 | 53.17 | 53.24 | 53.31 | 53.37 | 53.44 |
| Woodie | 52.15 | 52.69 | 52.88 | 53.42 | 53.61 | 54.15 | 54.34 |
| Fibonacci | 52.75 | 53.03 | 53.20 | 53.48 | 53.76 | 53.93 | 54.21 |
| Pivot points | S3 | S2 | S1 | PP | R1 | R2 | R3 |
|---|---|---|---|---|---|---|---|
| Standard | 51.09 | 52.17 | 52.70 | 53.78 | 54.31 | 55.39 | 55.92 |
| Camarilla | 52.80 | 52.95 | 53.09 | 53.24 | 53.39 | 53.54 | 53.68 |
| Woodie | 50.83 | 52.03 | 52.44 | 53.64 | 54.05 | 55.25 | 55.66 |
| Fibonacci | 52.17 | 52.78 | 53.16 | 53.78 | 54.39 | 54.77 | 55.39 |
| Pivot points | S3 | S2 | S1 | PP | R1 | R2 | R3 |
|---|---|---|---|---|---|---|---|
| Standard | 52.01 | 53.00 | 53.51 | 54.50 | 55.01 | 56.00 | 56.51 |
| Camarilla | 53.60 | 53.74 | 53.87 | 54.01 | 54.15 | 54.29 | 54.42 |
| Woodie | 51.76 | 52.88 | 53.26 | 54.38 | 54.76 | 55.88 | 56.26 |
| Fibonacci | 53.00 | 53.58 | 53.93 | 54.50 | 55.08 | 55.43 | 56.00 |
Numerical data
The following is the status of the technical indicators and moving averages at the time of publication of this technical analysis:
| RSI (14): | 25.55 | |
| MACD (12,26,9): | -0.3800 | |
| Directional Movement: | -24.42 | |
| AROON (14): | -35.71 | |
| DEMA (21): | 53.68 | |
| Parabolic SAR (0,02-0,02-0,2): | 54.76 | |
| Elder Ray (13): | -1.06 | |
| Super Trend (3,10): | 54.61 | |
| Zig ZAG (10): | 52.49 | |
| VORTEX (21): | 0.8100 | |
| Stochastique (14,3,5): | 2.66 | |
| TEMA (21): | 53.56 | |
| Williams %R (14): | -99.37 | |
| Chande Momentum Oscillator (20): | -1.95 | |
| Repulse (5,40,3): | -3.3700 | |
| ROCnROLL: | 2 | |
| TRIX (15,9): | -0.0700 | |
| Courbe Coppock: | 1.95 |
| MA7: | 53.91 | |
| MA20: | 54.16 | |
| MA50: | 54.80 | |
| MA100: | 55.60 | |
| MAexp7: | 53.62 | |
| MAexp20: | 54.13 | |
| MAexp50: | 54.73 | |
| MAexp100: | 55.43 | |
| Price / MA7: | -2.76% | |
| Price / MA20: | -3.21% | |
| Price / MA50: | -4.34% | |
| Price / MA100: | -5.72% | |
| Price / MAexp7: | -2.24% | |
| Price / MAexp20: | -3.16% | |
| Price / MAexp50: | -4.22% | |
| Price / MAexp100: | -5.43% |
News
Don't forget to follow the news on VERIZON COMMUNICATIONS INC.. At the time of publication of this analysis, the latest news was as follows:
-
 Verizon Shares Drop After Missing Quarterly Revenue Estimates
- Thinking about buying stock in Avalon GloboCare Corp., MagneGas, Square Inc., Trevena Inc. or Verizon Communications?
-
Verizon Cuts Media Jobs
-
Verizon CEO on what 5G means for consumers
- Verizon and Cat® Phones Partner to Bring the Cat® S48c Smartphone to Verizon Customers
About author

Online


Add a comment
Comments
0 comments on the analysis VERIZON COMMUNICATIONS INC. - Daily