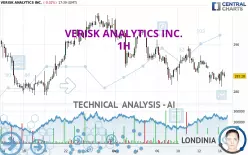
VERISK ANALYTICS INC. - 1H - Technical analysis published on 12/16/2024 (GMT)
- 95
- 0
Click here for a new analysis!
- Timeframe : 1H
- - Analysis generated on
- Status : TARGET REACHED

Summary of the analysis

Additional analysis
Quotes
The VERISK ANALYTICS INC. price is 283.28 USD. The price registered a decrease of -0.03% on the session with the lowest point at 280.99 USD and the highest point at 284.70 USD. The deviation from the price is +0.81% for the low point and -0.50% for the high point.Here is a more detailed summary of the historical variations registered by VERISK ANALYTICS INC.:
Near a new HIGH record (5 years)
Type : Bullish
Timeframe : Weekly
Near a new HIGH record (1 year)
Type : Bullish
Timeframe : Weekly
Near a new HIGH record (1st january)
Type : Bullish
Timeframe : Weekly
Near a new HIGH record (1 month)
Type : Bullish
Timeframe : Weekly
Technical
Technical analysis of VERISK ANALYTICS INC. in 1H shows a overall strongly bearish trend. 92.86% of the signals given by moving averages are bearish. This strongly bearish trend is supported by the strong bearish signals given by short-term moving averages. There is no crossing of moving average by the price or crossing of moving averages between themselves.
An assessment of technical indicators does not currently provide any relevant information on the direction of future price movements.
The Central Indicators scanner specialised in technical indicators, has not detected anything further.
An analysis of the price chart with the Central Patterns scanner (detector of chart patterns and resistances and supports) shows several results that can have an impact on the price change:
Near support of channel
Type : Bullish
Timeframe : 1 hour
Near support of triangle
Type : Bullish
Timeframe : 1 hour
The Central Candlesticks scanner, specialised in Japanese candlesticks, did not identify any signals.
| S3 | S2 | S1 | Price | R1 | R2 | R3 | |
|---|---|---|---|---|---|---|---|
| ProTrendLines | 278.87 | 281.00 | 283.17 | 283.28 | 285.20 | 287.23 | 291.03 |
| Change (%) | -1.56% | -0.80% | -0.04% | - | +0.68% | +1.39% | +2.74% |
| Change | -4.41 | -2.28 | -0.11 | - | +1.92 | +3.95 | +7.75 |
| Level | Major | Intermediate | Minor | - | Major | Intermediate | Minor |
Attention could also be paid to pivot points to set price objectives:
| Pivot points | S3 | S2 | S1 | PP | R1 | R2 | R3 |
|---|---|---|---|---|---|---|---|
| Standard | 279.62 | 280.72 | 282.03 | 283.13 | 284.44 | 285.54 | 286.85 |
| Camarilla | 282.69 | 282.91 | 283.13 | 283.35 | 283.57 | 283.79 | 284.01 |
| Woodie | 279.74 | 280.77 | 282.15 | 283.18 | 284.56 | 285.59 | 286.97 |
| Fibonacci | 280.72 | 281.64 | 282.21 | 283.13 | 284.05 | 284.62 | 285.54 |
| Pivot points | S3 | S2 | S1 | PP | R1 | R2 | R3 |
|---|---|---|---|---|---|---|---|
| Standard | 271.65 | 276.33 | 279.84 | 284.52 | 288.03 | 292.71 | 296.22 |
| Camarilla | 281.10 | 281.85 | 282.60 | 283.35 | 284.10 | 284.85 | 285.60 |
| Woodie | 271.07 | 276.04 | 279.26 | 284.23 | 287.45 | 292.42 | 295.64 |
| Fibonacci | 276.33 | 279.46 | 281.39 | 284.52 | 287.65 | 289.58 | 292.71 |
| Pivot points | S3 | S2 | S1 | PP | R1 | R2 | R3 |
|---|---|---|---|---|---|---|---|
| Standard | 252.06 | 261.36 | 277.59 | 286.89 | 303.12 | 312.42 | 328.65 |
| Camarilla | 286.80 | 289.14 | 291.48 | 293.82 | 296.16 | 298.50 | 300.84 |
| Woodie | 255.53 | 263.09 | 281.06 | 288.62 | 306.59 | 314.15 | 332.12 |
| Fibonacci | 261.36 | 271.11 | 277.14 | 286.89 | 296.64 | 302.67 | 312.42 |
Numerical data
The following is the status of the technical indicators and moving averages at the time of publication of this technical analysis:
| RSI (14): | 47.85 | |
| MACD (12,26,9): | -0.6500 | |
| Directional Movement: | -10.17 | |
| AROON (14): | -85.71 | |
| DEMA (21): | 283.17 | |
| Parabolic SAR (0,02-0,02-0,2): | 280.99 | |
| Elder Ray (13): | 0.18 | |
| Super Trend (3,10): | 286.91 | |
| Zig ZAG (10): | 283.80 | |
| VORTEX (21): | 0.9100 | |
| Stochastique (14,3,5): | 56.93 | |
| TEMA (21): | 283.18 | |
| Williams %R (14): | -40.76 | |
| Chande Momentum Oscillator (20): | -0.77 | |
| Repulse (5,40,3): | 0.2700 | |
| ROCnROLL: | -1 | |
| TRIX (15,9): | -0.0400 | |
| Courbe Coppock: | 1.35 |
| MA7: | 284.91 | |
| MA20: | 287.56 | |
| MA50: | 279.04 | |
| MA100: | 273.48 | |
| MAexp7: | 283.57 | |
| MAexp20: | 284.10 | |
| MAexp50: | 285.40 | |
| MAexp100: | 285.95 | |
| Price / MA7: | -0.57% | |
| Price / MA20: | -1.49% | |
| Price / MA50: | +1.52% | |
| Price / MA100: | +3.58% | |
| Price / MAexp7: | -0.10% | |
| Price / MAexp20: | -0.29% | |
| Price / MAexp50: | -0.74% | |
| Price / MAexp100: | -0.93% |
News
Don't forget to follow the news on VERISK ANALYTICS INC.. At the time of publication of this analysis, the latest news was as follows:
- Lockton Re Selects Verisk U.S. Agricultural Risk Models to Develop New (Re)Insurance Solutions
- Verisk Offers Insurers Address-Level Insights to Better Assess Fire Protection Capabilities
- Verisk Reports Third-Quarter 2024 Financial Results
- Verisk Debuts New Statistical Reporting Technology on Guidewire Marketplace
- Verisk CEO Lee Shavel Appointed to Federal Advisory Committee on Insurance
About author
Online


Add a comment
Comments
0 comments on the analysis VERISK ANALYTICS INC. - 1H