VERISK ANALYTICS INC. - 1H - Technical analysis published on 11/18/2024 (GMT)
- 116
- 0
Click here for a new analysis!
- Timeframe : 1H
- - Analysis generated on
- Status : INVALID

Summary of the analysis

Additional analysis
Quotes
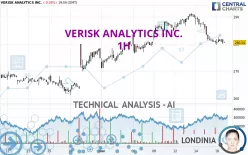
VERISK ANALYTICS INC. rating 280.54 USD. The price is lower by -0.09% since the last closing with the lowest point at 279.63 USD and the highest point at 282.48 USD. The deviation from the price is +0.33% for the low point and -0.69% for the high point.The Central Gaps scanner detects a bearish opening. A small advantage for sellers in the very short term.
Bearish opening
Type : Bearish
Timeframe : Openning
Here is a more detailed summary of the historical variations registered by VERISK ANALYTICS INC.:
Near a new HIGH record (5 years)
Type : Bullish
Timeframe : Weekly
Near a new HIGH record (1 year)
Type : Bullish
Timeframe : Weekly
Near a new HIGH record (1st january)
Type : Bullish
Timeframe : Weekly
Near a new HIGH record (1 month)
Type : Bullish
Timeframe : Weekly
Technical
Technical analysis of this 1H chart of VERISK ANALYTICS INC. indicates that the overall trend is slightly bearish. 60.71% of the signals given by moving averages are bearish. This slightly bearish trend could be reinforced by the strong bearish signals given by short-term moving averages. An assessment of moving averages reveals a bearish signal that could impact this trend:
Bearish trend reversal : adaptative moving average 100
Type : Bearish
Timeframe : 1 hour
The technical indicators are generally neutral. They do not provide relevant information on the direction of future price movements.
Caution: the Central Indicators scanner currently detects an excess:
MACD indicator: bullish divergence
Type : Bullish
Timeframe : 1 hour
Williams %R indicator is oversold : under -80
Type : Neutral
Timeframe : 1 hour
No signals are given by Central Patterns, a market scanner specialised in chart patterns, resistances and supports.
Central Candlesticks, the scanner specialised in Japanese candlesticks, detects this inversion signal that could impact the current short-term trend:
Doji
Type : Neutral
Timeframe : 1 hour
| S3 | S2 | S1 | Price | R1 | R2 | |
|---|---|---|---|---|---|---|
| ProTrendLines | 273.37 | 277.07 | 280.00 | 280.54 | 285.58 | 291.42 |
| Change (%) | -2.56% | -1.24% | -0.19% | - | +1.80% | +3.88% |
| Change | -7.17 | -3.47 | -0.54 | - | +5.04 | +10.88 |
| Level | Minor | Intermediate | Intermediate | - | Major | Intermediate |
To determine price objectives, it is also possible to use the pivot points. Here is the price position in relation to pivot points:
| Pivot points | S3 | S2 | S1 | PP | R1 | R2 | R3 |
|---|---|---|---|---|---|---|---|
| Standard | 272.11 | 276.13 | 278.46 | 282.48 | 284.81 | 288.83 | 291.16 |
| Camarilla | 279.05 | 279.64 | 280.22 | 280.80 | 281.38 | 281.96 | 282.55 |
| Woodie | 271.28 | 275.71 | 277.63 | 282.06 | 283.98 | 288.41 | 290.33 |
| Fibonacci | 276.13 | 278.55 | 280.05 | 282.48 | 284.90 | 286.40 | 288.83 |
| Pivot points | S3 | S2 | S1 | PP | R1 | R2 | R3 |
|---|---|---|---|---|---|---|---|
| Standard | 265.54 | 272.84 | 276.82 | 284.12 | 288.10 | 295.40 | 299.38 |
| Camarilla | 277.70 | 278.73 | 279.77 | 280.80 | 281.83 | 282.87 | 283.90 |
| Woodie | 263.88 | 272.01 | 275.16 | 283.29 | 286.44 | 294.57 | 297.72 |
| Fibonacci | 272.84 | 277.15 | 279.81 | 284.12 | 288.43 | 291.09 | 295.40 |
| Pivot points | S3 | S2 | S1 | PP | R1 | R2 | R3 |
|---|---|---|---|---|---|---|---|
| Standard | 245.03 | 253.08 | 263.90 | 271.95 | 282.77 | 290.82 | 301.64 |
| Camarilla | 269.53 | 271.26 | 272.99 | 274.72 | 276.45 | 278.18 | 279.91 |
| Woodie | 246.42 | 253.77 | 265.29 | 272.64 | 284.16 | 291.51 | 303.03 |
| Fibonacci | 253.08 | 260.29 | 264.74 | 271.95 | 279.16 | 283.61 | 290.82 |
Numerical data
The following is the status of technical indicators and moving averages registered at the time this technical analysis was created:
| RSI (14): | 33.45 | |
| MACD (12,26,9): | -1.6200 | |
| Directional Movement: | -17.12 | |
| AROON (14): | -64.29 | |
| DEMA (21): | 281.06 | |
| Parabolic SAR (0,02-0,02-0,2): | 281.93 | |
| Elder Ray (13): | -1.33 | |
| Super Trend (3,10): | 285.01 | |
| Zig ZAG (10): | 280.57 | |
| VORTEX (21): | 0.7100 | |
| Stochastique (14,3,5): | 15.84 | |
| TEMA (21): | 279.38 | |
| Williams %R (14): | -87.75 | |
| Chande Momentum Oscillator (20): | -2.93 | |
| Repulse (5,40,3): | -0.2300 | |
| ROCnROLL: | 2 | |
| TRIX (15,9): | -0.0700 | |
| Courbe Coppock: | 4.19 |
| MA7: | 285.07 | |
| MA20: | 276.41 | |
| MA50: | 271.44 | |
| MA100: | 271.39 | |
| MAexp7: | 281.15 | |
| MAexp20: | 283.01 | |
| MAexp50: | 283.53 | |
| MAexp100: | 280.81 | |
| Price / MA7: | -1.59% | |
| Price / MA20: | +1.49% | |
| Price / MA50: | +3.35% | |
| Price / MA100: | +3.37% | |
| Price / MAexp7: | -0.22% | |
| Price / MAexp20: | -0.87% | |
| Price / MAexp50: | -1.05% | |
| Price / MAexp100: | -0.10% |
News
Don't forget to follow the news on VERISK ANALYTICS INC.. At the time of publication of this analysis, the latest news was as follows:
- Verisk Reports Third-Quarter 2024 Financial Results
- Verisk Debuts New Statistical Reporting Technology on Guidewire Marketplace
- Verisk CEO Lee Shavel Appointed to Federal Advisory Committee on Insurance
- Verisk Estimates Industry Insured Losses for Hurricane Milton Will Range Between USD 30 Billion to USD 50 Billion
- Verisk to Announce Fiscal Third-Quarter 2024 Results on October 30, 2024
About author
Online


Add a comment
Comments
0 comments on the analysis VERISK ANALYTICS INC. - 1H