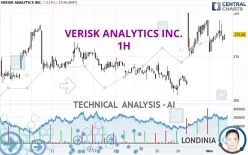
VERISK ANALYTICS INC. - 1H - Technical analysis published on 11/04/2024 (GMT)
- 156
- 0
Click here for a new analysis!
- Timeframe : 1H
- - Analysis generated on
- Status : TARGET REACHED

Summary of the analysis

Additional analysis
Quotes
The VERISK ANALYTICS INC. price is 275.09 USD. The price is lower by -0.14% since the last closing with the lowest point at 273.28 USD and the highest point at 278.46 USD. The deviation from the price is +0.66% for the low point and -1.21% for the high point.The Central Gaps scanner detects a bullish opening marking the presence of buyers ahead of sellers at the opening but not sufficiently marked to allow the price to register a quotation gap.
Bullish opening
Type : Bullish
Timeframe : Openning
Here is a more detailed summary of the historical variations registered by VERISK ANALYTICS INC.:
Near a new HIGH record (5 years)
Type : Bullish
Timeframe : Weekly
Near a new HIGH record (1 year)
Type : Bullish
Timeframe : Weekly
Near a new HIGH record (1st january)
Type : Bullish
Timeframe : Weekly
Near a new LOW record (1 month)
Type : Bearish
Timeframe : Weekly
Technical
Technical analysis of VERISK ANALYTICS INC. in 1H shows a strongly overall bullish trend. 85.71% of the signals given by moving averages are bullish. The slightly bullish signals given by the short-term moving averages indicate this trend is showing signs of running out of steam. The Central Indicators scanner detects a bullish signal on moving averages that could impact this trend:
Bullish price crossover with adaptative moving average 20
Type : Bullish
Timeframe : 1 hour
In fact, of the 18 technical indicators analysed by Central Analyzer, 6 are bullish, 7 are neutral and 5 are bearish. Central Indicators, the scanner specialised in technical indicators, has identified these signals:
Price is back over the pivot point
Type : Bullish
Timeframe : 1 hour
Williams %R indicator is back over -50
Type : Bullish
Timeframe : 1 hour
No signals are given by Central Patterns, a market scanner specialised in chart patterns, resistances and supports.
The presence of a bullish Japanese candlestick pattern detected by Central Candlesticks that could cause a very short term rebound was also detected:
White morning star
Type : Bullish
Timeframe : 1 hour
| S3 | S2 | S1 | Price | R1 | R2 | R3 | |
|---|---|---|---|---|---|---|---|
| ProTrendLines | 266.42 | 269.99 | 273.96 | 275.09 | 278.53 | 280.00 | 285.58 |
| Change (%) | -3.15% | -1.85% | -0.41% | - | +1.25% | +1.78% | +3.81% |
| Change | -8.67 | -5.10 | -1.13 | - | +3.44 | +4.91 | +10.49 |
| Level | Intermediate | Intermediate | Major | - | Intermediate | Minor | Major |
Attention could also be paid to pivot points to set price objectives:
| Pivot points | S3 | S2 | S1 | PP | R1 | R2 | R3 |
|---|---|---|---|---|---|---|---|
| Standard | 267.23 | 269.13 | 272.30 | 274.20 | 277.37 | 279.27 | 282.44 |
| Camarilla | 274.09 | 274.55 | 275.02 | 275.48 | 275.95 | 276.41 | 276.87 |
| Woodie | 267.88 | 269.45 | 272.95 | 274.52 | 278.02 | 279.59 | 283.09 |
| Fibonacci | 269.13 | 271.06 | 272.26 | 274.20 | 276.13 | 277.33 | 279.27 |
| Pivot points | S3 | S2 | S1 | PP | R1 | R2 | R3 |
|---|---|---|---|---|---|---|---|
| Standard | 245.54 | 253.33 | 264.41 | 272.20 | 283.28 | 291.07 | 302.15 |
| Camarilla | 270.29 | 272.02 | 273.75 | 275.48 | 277.21 | 278.94 | 280.67 |
| Woodie | 247.18 | 254.15 | 266.05 | 273.02 | 284.92 | 291.89 | 303.79 |
| Fibonacci | 253.33 | 260.54 | 265.00 | 272.20 | 279.41 | 283.87 | 291.07 |
| Pivot points | S3 | S2 | S1 | PP | R1 | R2 | R3 |
|---|---|---|---|---|---|---|---|
| Standard | 245.03 | 253.08 | 263.90 | 271.95 | 282.77 | 290.82 | 301.64 |
| Camarilla | 269.53 | 271.26 | 272.99 | 274.72 | 276.45 | 278.18 | 279.91 |
| Woodie | 246.42 | 253.77 | 265.29 | 272.64 | 284.16 | 291.51 | 303.03 |
| Fibonacci | 253.08 | 260.29 | 264.74 | 271.95 | 279.16 | 283.61 | 290.82 |
Numerical data
The following is the status of the technical indicators and moving averages at the time of publication of this technical analysis:
| RSI (14): | 55.85 | |
| MACD (12,26,9): | 1.4600 | |
| Directional Movement: | 12.46 | |
| AROON (14): | -7.14 | |
| DEMA (21): | 276.07 | |
| Parabolic SAR (0,02-0,02-0,2): | 278.51 | |
| Elder Ray (13): | -0.01 | |
| Super Trend (3,10): | 270.73 | |
| Zig ZAG (10): | 274.74 | |
| VORTEX (21): | 1.0800 | |
| Stochastique (14,3,5): | 52.84 | |
| TEMA (21): | 276.02 | |
| Williams %R (14): | -50.53 | |
| Chande Momentum Oscillator (20): | -2.83 | |
| Repulse (5,40,3): | -0.6600 | |
| ROCnROLL: | 1 | |
| TRIX (15,9): | 0.1000 | |
| Courbe Coppock: | 0.63 |
| MA7: | 270.25 | |
| MA20: | 269.45 | |
| MA50: | 269.01 | |
| MA100: | 269.84 | |
| MAexp7: | 274.90 | |
| MAexp20: | 273.90 | |
| MAexp50: | 271.31 | |
| MAexp100: | 269.80 | |
| Price / MA7: | +1.79% | |
| Price / MA20: | +2.09% | |
| Price / MA50: | +2.26% | |
| Price / MA100: | +1.95% | |
| Price / MAexp7: | +0.07% | |
| Price / MAexp20: | +0.43% | |
| Price / MAexp50: | +1.39% | |
| Price / MAexp100: | +1.96% |
News
The latest news and videos published on VERISK ANALYTICS INC. at the time of the analysis were as follows:
- Verisk Reports Third-Quarter 2024 Financial Results
- Verisk Debuts New Statistical Reporting Technology on Guidewire Marketplace
- Verisk CEO Lee Shavel Appointed to Federal Advisory Committee on Insurance
- Verisk Estimates Industry Insured Losses for Hurricane Milton Will Range Between USD 30 Billion to USD 50 Billion
- Verisk to Announce Fiscal Third-Quarter 2024 Results on October 30, 2024
About author
Online


Add a comment
Comments
0 comments on the analysis VERISK ANALYTICS INC. - 1H