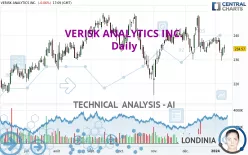
VERISK ANALYTICS INC. - Daily - Technical analysis published on 01/10/2024 (GMT)
- 198
- 0
Click here for a new analysis!
- Timeframe : Daily
- - Analysis generated on
- Status : INVALID

Summary of the analysis

Additional analysis
Quotes
VERISK ANALYTICS INC. rating 234.57 USD. The price is lower by -0.06% since the last closing and was between 232.85 USD and 236.17 USD. This implies that the price is at +0.74% from its lowest and at -0.68% from its highest.A bullish gap was detected at the opening by the Central Gaps scanner. There are a lot of buyers and they have the upper hand in the very short term.
Opening Gap UP
Type : Bullish
Timeframe : Openning
Here is a more detailed summary of the historical variations registered by VERISK ANALYTICS INC.:
Near a new HIGH record (1st january)
Type : Bullish
Timeframe : Weekly
Near a new LOW record (1 month)
Type : Bearish
Timeframe : Weekly
Technical
A technical analysis in Daily of this VERISK ANALYTICS INC. chart shows a neutral trend. The strong bearish signals currently being given by short-term moving averages could allow the overall trend to return to a bearish trend. The Central Indicators market scanner is currently detecting several bullish signals that could impact this trend:
Bullish trend reversal : Moving Average 100
Type : Bullish
Timeframe : Daily
Bullish trend reversal : adaptative moving average 100
Type : Bullish
Timeframe : Daily
In fact, of the 18 technical indicators analysed by Central Analyzer, 4 are bullish, 8 are neutral and 6 are bearish. Central Indicators, the detector scanner for these technical indicators has recently detected several signals:
Momentum indicator is back under 0
Type : Bearish
Timeframe : Daily
Williams %R indicator is back under -50
Type : Bearish
Timeframe : Daily
Central Patterns, the scanner specializing in chart patterns, did not identify any signals.
No result was found by the Central Candlesticks scanner on Japanese candlesticks.
| S3 | S2 | S1 | Price | R1 | R2 | |
|---|---|---|---|---|---|---|
| ProTrendLines | 221.73 | 226.72 | 233.47 | 234.57 | 242.40 | 247.97 |
| Change (%) | -5.47% | -3.35% | -0.47% | - | +3.34% | +5.71% |
| Change | -12.84 | -7.85 | -1.10 | - | +7.83 | +13.40 |
| Level | Major | Major | Major | - | Intermediate | Major |
Attention could also be paid to pivot points to set price objectives:
| Pivot points | S3 | S2 | S1 | PP | R1 | R2 | R3 |
|---|---|---|---|---|---|---|---|
| Standard | 228.38 | 229.84 | 232.28 | 233.74 | 236.18 | 237.64 | 240.08 |
| Camarilla | 233.65 | 234.01 | 234.36 | 234.72 | 235.08 | 235.44 | 235.79 |
| Woodie | 228.87 | 230.09 | 232.77 | 233.99 | 236.67 | 237.89 | 240.57 |
| Fibonacci | 229.84 | 231.33 | 232.25 | 233.74 | 235.23 | 236.15 | 237.64 |
| Pivot points | S3 | S2 | S1 | PP | R1 | R2 | R3 |
|---|---|---|---|---|---|---|---|
| Standard | 224.84 | 228.84 | 231.27 | 235.27 | 237.70 | 241.70 | 244.13 |
| Camarilla | 231.93 | 232.52 | 233.11 | 233.70 | 234.29 | 234.88 | 235.47 |
| Woodie | 224.06 | 228.45 | 230.49 | 234.88 | 236.92 | 241.31 | 243.35 |
| Fibonacci | 228.84 | 231.30 | 232.81 | 235.27 | 237.73 | 239.24 | 241.70 |
| Pivot points | S3 | S2 | S1 | PP | R1 | R2 | R3 |
|---|---|---|---|---|---|---|---|
| Standard | 210.95 | 220.41 | 229.63 | 239.09 | 248.31 | 257.77 | 266.99 |
| Camarilla | 233.72 | 235.44 | 237.15 | 238.86 | 240.57 | 242.29 | 244.00 |
| Woodie | 210.84 | 220.35 | 229.52 | 239.03 | 248.20 | 257.71 | 266.88 |
| Fibonacci | 220.41 | 227.54 | 231.95 | 239.09 | 246.22 | 250.63 | 257.77 |
Numerical data
The following are the details of the technical indicators and moving averages that were collected to generate this technical analysis:
| RSI (14): | 45.80 | |
| MACD (12,26,9): | -0.6600 | |
| Directional Movement: | -7.46 | |
| AROON (14): | -28.57 | |
| DEMA (21): | 235.48 | |
| Parabolic SAR (0,02-0,02-0,2): | 241.50 | |
| Elder Ray (13): | -1.23 | |
| Super Trend (3,10): | 232.57 | |
| Zig ZAG (10): | 234.18 | |
| VORTEX (21): | 1.0200 | |
| Stochastique (14,3,5): | 45.07 | |
| TEMA (21): | 234.75 | |
| Williams %R (14): | -50.10 | |
| Chande Momentum Oscillator (20): | -0.62 | |
| Repulse (5,40,3): | 0.1900 | |
| ROCnROLL: | 2 | |
| TRIX (15,9): | -0.0200 | |
| Courbe Coppock: | 1.19 |
| MA7: | 235.46 | |
| MA20: | 236.78 | |
| MA50: | 236.09 | |
| MA100: | 237.60 | |
| MAexp7: | 235.13 | |
| MAexp20: | 236.18 | |
| MAexp50: | 236.48 | |
| MAexp100: | 234.05 | |
| Price / MA7: | -0.38% | |
| Price / MA20: | -0.93% | |
| Price / MA50: | -0.64% | |
| Price / MA100: | -1.28% | |
| Price / MAexp7: | -0.24% | |
| Price / MAexp20: | -0.68% | |
| Price / MAexp50: | -0.81% | |
| Price / MAexp100: | +0.22% |
News
The latest news and videos published on VERISK ANALYTICS INC. at the time of the analysis were as follows:
- Verisk Names Doug Caccese and Saurabh Khemka Co-Presidents of Underwriting Solutions
- Verisk Estimates Industry Insured Losses for the Noto Peninsula Earthquake to Range from JPY 260 Billion to JPY 480 Billion (USD 1.8 Billion to 3.3 Billion)
- California Department of Insurance Approves Verisk's ISO Wildfire Mitigation Filings for Homeowners, Dwelling, Commercial Property, Commercial Inland Marine and Businessowners Programs
- Verisk Ranks No. 4 on Investor’s Business Daily’s 100 Best ESG Companies List
- Verisk LightSpeed® Small Commercial Accelerator Added to Guidewire Marketplace
About author
Online


Add a comment
Comments
0 comments on the analysis VERISK ANALYTICS INC. - Daily