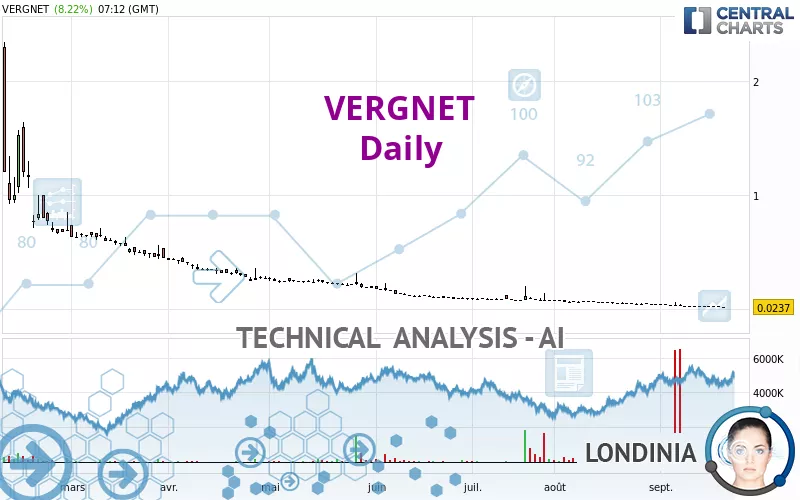
VERGNET - Daily - Technical analysis published on 09/19/2024 (GMT)
- 127
- 0
Click here for a new analysis!
- Timeframe : Daily
- - Analysis generated on
- Status : TARGET REACHED
Summary of the analysis

Additional analysis
Quotes
The VERGNET rating is 0.0237 EUR. The price has increased by +8.22% since the last closing and was traded between 0.0216 EUR and 0.0240 EUR over the period. The price is currently at +9.72% from its lowest and -1.25% from its highest.A bullish opening was detected by the Central Gaps scanner. Buyers are trying to impose a bullish momentum in the very short term.
Bullish opening
Type : Bullish
Timeframe : Openning
Here is a more detailed summary of the historical variations registered by VERGNET:
New LOW record (5 years)
Type : Bearish
Timeframe : Weekly
Near a new LOW record (1 year)
Type : Bearish
Timeframe : Weekly
Near a new LOW record (1st january)
Type : Bearish
Timeframe : Weekly
Near a new LOW record (1 month)
Type : Bearish
Timeframe : Weekly
The Central Volumes scanner detects abnormal volumes on the asset:
Abnormal volumes
Timeframe : 20 days
Abnormal volumes
Timeframe : 50 days
Technical
Technical analysis of VERGNET in Daily shows a overall strongly bearish trend. 92.86% of the signals given by moving averages are bearish. The overall trend is supported by the strong bearish signals from short-term moving averages. The Central Indicators market scanner currently does not detect any result that concerns moving averages.
An assessment of technical indicators does not currently provide any relevant information on the direction of future price movements.
But beware of excesses. The Central Indicators scanner currently detects this:
RSI indicator is oversold : under 20
Type : Neutral
Timeframe : Daily
Williams %R indicator is oversold : under -80
Type : Neutral
Timeframe : Daily
The analysis of the price chart with Central Patterns scanners does not return any result.
The Central Candlesticks scanner which studies Japanese candlesticks did not detect anything.
| Price | R1 | R2 | R3 | |
|---|---|---|---|---|
| ProTrendLines | 0.0237 | 0.6301 | 1.4020 | 2.1995 |
| Change (%) | - | +2,558.65% | +5,815.61% | +9,180.59% |
| Change | - | +0.6064 | +1.3783 | +2.1758 |
| Level | - | Minor | Minor | Major |
Pivot points can also be used to set your price objectives. Here is the price situation in relation to pivot points:
| Pivot points | S3 | S2 | S1 | PP | R1 | R2 | R3 |
|---|---|---|---|---|---|---|---|
| Standard | 0.0168 | 0.0190 | 0.0204 | 0.0226 | 0.0240 | 0.0262 | 0.0276 |
| Camarilla | 0.0209 | 0.0212 | 0.0216 | 0.0219 | 0.0222 | 0.0226 | 0.0229 |
| Woodie | 0.0165 | 0.0188 | 0.0201 | 0.0224 | 0.0237 | 0.0260 | 0.0273 |
| Fibonacci | 0.0190 | 0.0203 | 0.0212 | 0.0226 | 0.0239 | 0.0248 | 0.0262 |
| Pivot points | S3 | S2 | S1 | PP | R1 | R2 | R3 |
|---|---|---|---|---|---|---|---|
| Standard | 0.0110 | 0.0170 | 0.0209 | 0.0269 | 0.0308 | 0.0368 | 0.0407 |
| Camarilla | 0.0220 | 0.0229 | 0.0238 | 0.0247 | 0.0256 | 0.0265 | 0.0274 |
| Woodie | 0.0099 | 0.0165 | 0.0198 | 0.0264 | 0.0297 | 0.0363 | 0.0396 |
| Fibonacci | 0.0170 | 0.0208 | 0.0232 | 0.0269 | 0.0307 | 0.0331 | 0.0368 |
| Pivot points | S3 | S2 | S1 | PP | R1 | R2 | R3 |
|---|---|---|---|---|---|---|---|
| Standard | 0.0007 | 0.0229 | 0.0357 | 0.0579 | 0.0707 | 0.0929 | 0.1057 |
| Camarilla | 0.0390 | 0.0422 | 0.0454 | 0.0486 | 0.0518 | 0.0550 | 0.0582 |
| Woodie | -0.0039 | 0.0206 | 0.0311 | 0.0556 | 0.0661 | 0.0906 | 0.1011 |
| Fibonacci | 0.0229 | 0.0362 | 0.0445 | 0.0579 | 0.0712 | 0.0795 | 0.0929 |
Numerical data
The following is the status of the technical indicators and moving averages at the time of publication of this technical analysis:
| RSI (14): | 22.34 | |
| MACD (12,26,9): | -0.0117 | |
| Directional Movement: | 7.2839 | |
| AROON (14): | -57.1429 | |
| DEMA (21): | 0.0188 | |
| Parabolic SAR (0,02-0,02-0,2): | 0.0510 | |
| Elder Ray (13): | -0.0063 | |
| Super Trend (3,10): | 0.0424 | |
| Zig ZAG (10): | 0.0237 | |
| VORTEX (21): | 0.7085 | |
| Stochastique (14,3,5): | 5.32 | |
| TEMA (21): | 0.0201 | |
| Williams %R (14): | -91.80 | |
| Chande Momentum Oscillator (20): | -0.0183 | |
| Repulse (5,40,3): | -20.2433 | |
| ROCnROLL: | 2 | |
| TRIX (15,9): | -3.0473 | |
| Courbe Coppock: | 98.98 |
| MA7: | 0.0239 | |
| MA20: | 0.0351 | |
| MA50: | 0.0589 | |
| MA100: | 0.1209 | |
| MAexp7: | 0.0247 | |
| MAexp20: | 0.0348 | |
| MAexp50: | 0.0680 | |
| MAexp100: | 0.1668 | |
| Price / MA7: | -0.84% | |
| Price / MA20: | -32.48% | |
| Price / MA50: | -59.76% | |
| Price / MA100: | -80.40% | |
| Price / MAexp7: | -4.05% | |
| Price / MAexp20: | -31.90% | |
| Price / MAexp50: | -65.15% | |
| Price / MAexp100: | -85.79% |
About author
Online


Add a comment
Comments
0 comments on the analysis VERGNET - Daily