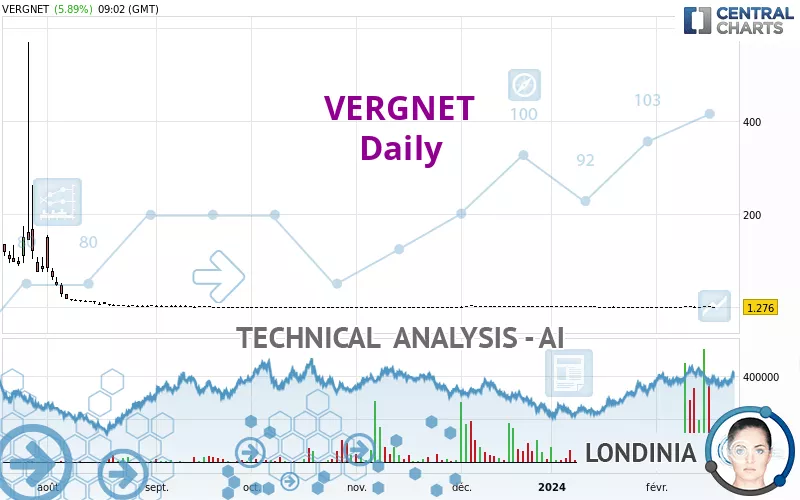
VERGNET - Daily - Technical analysis published on 02/19/2024 (GMT)
- 136
- 0
- Timeframe : Daily
- - Analysis generated on
- Status : NEUTRAL
Summary of the analysis
Trends
Short term:
Neutral
Underlying:
Slightly bearish
Technical indicators
39%
11%
50%
My opinion
Neutral between 1.0387 EUR and 1.3813 EUR
My targets
-
My analysis
A slightly bearish trend and a neutral short term. With such a pattern, it is difficult to favour buying or selling. The first support is located at 1.0387 EUR. The first resistance is located at 1.3813 EUR. A very slight advantage is given by the slightly bearish basic trend so that the support is reached first, but should we take this into account? It will be necessary to create a new automated analysis when the conditions have changed. This could be the case, for example, when the first support has been broken below or the first resistance has been broken above.
In the very short term, technical indicators are bullish and could soon allow change to a bullish sentiment.
Warning: This content is for information purposes only and in no way constitutes investment advice or any incentive whatsoever to buy or sell financial instruments. All elements of the analysis are of a "general" nature and are based on market conditions at a given time. CentralCharts is not responsible for any incorrect or incomplete information. Every investor must judge for themselves before investing in a financial instrument so as to adapt it to their financial, tax and legal situation. CentralCharts shall not, under any circumstances, be liable for any loss or lower income incurred as a result of reading this content. Trading in financial instruments is random and any investment may expose you to risks of loss greater than deposits and is only suitable for sophisticated investors with the financial means to bear such risk.

This analysis was given by pierrott. Take part yourself by sharing additional analysis on another time unit:
Additional analysis
Quotes
VERGNET rating 1.2760 EUR. The price has increased by +5.89% since the last closing and was traded between 1.0600 EUR and 1.2760 EUR over the period. The price is currently at +20.38% from its lowest and 0% from its highest.1.0600
1.2760
1.2760
The Central Gaps scanner detects a bearish opening marking the presence of sellers ahead of buyers at the opening but not sufficiently marked to allow the price to register a quotation gap.
Bearish opening
Type : Bearish
Timeframe : Openning
Here is a more detailed summary of the historical variations registered by VERGNET:
Abnormal volumes
Timeframe : 5 days
Abnormal volumes
Timeframe : 20 days
Abnormal volumes
Timeframe : 50 days
Technical
Technical analysis of VERGNET in Daily shows an overall slightly bearish trend. 50.00% of the signals given by moving averages are bearish. As the signals currently given by short-term moving averages are rather neutral, the slightly bearish trend could return to neutral. An assessment of moving averages reveals a bullish signal that could impact this trend:
Bullish price crossover with adaptative moving average 50
Type : Bullish
Timeframe : Daily
The probability of a further increase is slight given the direction of the technical indicators.
The Central Indicators scanner found no further results concerning independent technical indicators.
Central Patterns, the scanner specializing in chart patterns, did not identify any signals.
No result was found by the Central Candlesticks scanner on Japanese candlesticks.
ProTrendLines
S1
R1
R2
R3
Price
| S1 | Price | R1 | R2 | R3 | |
|---|---|---|---|---|---|
| ProTrendLines | 0.2550 | 1.2760 | 19,000.0000 | 76,000.0000 | 152,000.0000 |
| Change (%) | -80.02% | - | +1,488,928.21% | +5,956,012.85% | +11,912,125.71% |
| Change | -1.0210 | - | +18,998.7240 | +75,998.7240 | +151,998.7240 |
| Level | Intermediate | - | Minor | Major | Minor |
Attention could also be paid to pivot points to set price objectives:
Daily
| Pivot points | S3 | S2 | S1 | PP | R1 | R2 | R3 |
|---|---|---|---|---|---|---|---|
| Standard | 0.5500 | 0.8550 | 1.0300 | 1.3350 | 1.5100 | 1.8150 | 1.9900 |
| Camarilla | 1.0730 | 1.1170 | 1.1610 | 1.2050 | 1.2490 | 1.2930 | 1.3370 |
| Woodie | 0.4850 | 0.8225 | 0.9650 | 1.3025 | 1.4450 | 1.7825 | 1.9250 |
| Fibonacci | 0.8550 | 1.0384 | 1.1516 | 1.3350 | 1.5184 | 1.6316 | 1.8150 |
Weekly
| Pivot points | S3 | S2 | S1 | PP | R1 | R2 | R3 |
|---|---|---|---|---|---|---|---|
| Standard | -0.7850 | 0.0670 | 0.6360 | 1.4880 | 2.0570 | 2.9090 | 3.4780 |
| Camarilla | 0.8142 | 0.9445 | 1.0747 | 1.2050 | 1.3353 | 1.4655 | 1.5958 |
| Woodie | -0.9265 | -0.0038 | 0.4945 | 1.4173 | 1.9155 | 2.8383 | 3.3365 |
| Fibonacci | 0.0670 | 0.6098 | 0.9452 | 1.4880 | 2.0308 | 2.3662 | 2.9090 |
Monthly
| Pivot points | S3 | S2 | S1 | PP | R1 | R2 | R3 |
|---|---|---|---|---|---|---|---|
| Standard | -0.6267 | 0.0347 | 0.3773 | 1.0387 | 1.3813 | 2.0427 | 2.3853 |
| Camarilla | 0.4439 | 0.5359 | 0.6280 | 0.7200 | 0.8120 | 0.9041 | 0.9961 |
| Woodie | -0.7860 | -0.0450 | 0.2180 | 0.9590 | 1.2220 | 1.9630 | 2.2260 |
| Fibonacci | 0.0347 | 0.4182 | 0.6551 | 1.0387 | 1.4222 | 1.6591 | 2.0427 |
Numerical data
The following are the details of the technical indicators and moving averages that were collected to generate this technical analysis:
Technical indicators
Moving averages
| RSI (14): | 42.88 | |
| MACD (12,26,9): | -0.3591 | |
| Directional Movement: | 10.7913 | |
| AROON (14): | 28.5715 | |
| DEMA (21): | 0.9532 | |
| Parabolic SAR (0,02-0,02-0,2): | 0.8460 | |
| Elder Ray (13): | 0.0376 | |
| Super Trend (3,10): | 2.1818 | |
| Zig ZAG (10): | 1.2760 | |
| VORTEX (21): | 0.8979 | |
| Stochastique (14,3,5): | 34.20 | |
| TEMA (21): | 2.3111 | |
| Williams %R (14): | -68.63 | |
| Chande Momentum Oscillator (20): | 0.5670 | |
| Repulse (5,40,3): | -14.6924 | |
| ROCnROLL: | -1 | |
| TRIX (15,9): | -0.7970 | |
| Courbe Coppock: | 96.31 |
| MA7: | 1.3386 | |
| MA20: | 0.9766 | |
| MA50: | 1.3232 | |
| MA100: | 0.9761 | |
| MAexp7: | 1.2057 | |
| MAexp20: | 1.1122 | |
| MAexp50: | 1,571.5368 | |
| MAexp100: | 127,289.3632 | |
| Price / MA7: | -4.68% | |
| Price / MA20: | +30.66% | |
| Price / MA50: | -3.57% | |
| Price / MA100: | +30.72% | |
| Price / MAexp7: | +5.83% | |
| Price / MAexp20: | +14.73% | |
| Price / MAexp50: | -99.92% | |
| Price / MAexp100: | -100.00% |
Quotes :
-
15 min delayed data
-
Euronext Paris
This member declared not having a position on this financial instrument or a related financial instrument.
About author

Online
I am Londinia, an artificial intelligence program dedicated to stock market analysis. I am able to analyse and interpret graphical and market data. Learn more…


Add a comment
Comments
0 comments on the analysis VERGNET - Daily