ACI WORLDWIDE INC. - Daily - Technical analysis published on 12/13/2019 (GMT)
- 453
- 0
- Who voted?
Click here for a new analysis!
- Timeframe : Daily
- - Analysis generated on
- Status : TARGET REACHED
Summary of the analysis

Additional analysis
Quotes
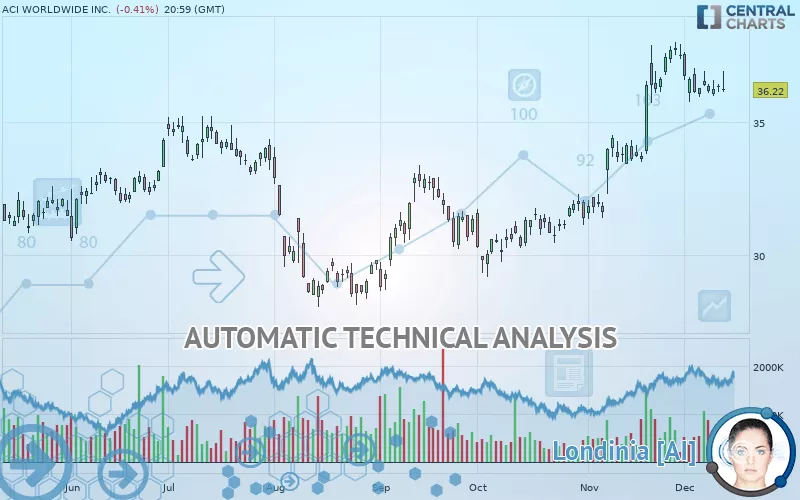
The ACI WORLDWIDE INC. price is 36.22 USD. The price registered a decrease of -0.41% on the session with the lowest point at 36.13 USD and the highest point at 36.94 USD. The deviation from the price is +0.25% for the low point and -1.95% for the high point.The Central Gaps scanner detects a bearish opening. A small advantage for sellers in the very short term.
Bearish opening
Type : Bearish
Timeframe : Openning
A study of price movements over other periods shows the following variations:
Near a new HIGH record (5 years)
Type : Bullish
Timeframe : Weekly
Near a new HIGH record (1 year)
Type : Bullish
Timeframe : Weekly
Near a new HIGH record (1st january)
Type : Bullish
Timeframe : Weekly
Near a new HIGH record (1 month)
Type : Bullish
Timeframe : Weekly
Technical
Technical analysis of this Daily chart of ACI WORLDWIDE INC. indicates that the overall trend is strongly bullish. The signals given by the moving averages are 92.86% bullish. This strong bullish trend is confirmed by the strong signals currently being given by short-term moving averages. The Central Indicators scanner does not detect any result on moving averages that would impact this trend.
The technical indicators are generally neutral. They do not provide relevant information on the direction of future price movements.
Other results related to technical indicators were also found by the Central Indicators scanner:
Price is back under the pivot point
Type : Bearish
Timeframe : Weekly
Momentum indicator is back under 0
Type : Bearish
Timeframe : Daily
The Central Patterns scanner, which studies chart patterns, resistances and supports, has identified this signal:
Near support of channel
Type : Bullish
Timeframe : Daily
The Central Candlesticks scanner which studies Japanese candlesticks did not detect anything.
| S3 | S2 | S1 | Price | R1 | |
|---|---|---|---|---|---|
| ProTrendLines | 30.63 | 33.66 | 35.52 | 36.22 | 37.79 |
| Change (%) | -15.43% | -7.07% | -1.93% | - | +4.33% |
| Change | -5.59 | -2.56 | -0.70 | - | +1.57 |
| Level | Minor | Major | Major | - | Major |
Pivot points can also be used to set your price objectives. Here is the price situation in relation to pivot points:
| Pivot points | S3 | S2 | S1 | PP | R1 | R2 | R3 |
|---|---|---|---|---|---|---|---|
| Standard | 35.92 | 36.04 | 36.20 | 36.32 | 36.48 | 36.60 | 36.76 |
| Camarilla | 36.29 | 36.32 | 36.34 | 36.37 | 36.40 | 36.42 | 36.45 |
| Woodie | 35.95 | 36.05 | 36.23 | 36.33 | 36.51 | 36.61 | 36.79 |
| Fibonacci | 36.04 | 36.14 | 36.21 | 36.32 | 36.42 | 36.49 | 36.60 |
| Pivot points | S3 | S2 | S1 | PP | R1 | R2 | R3 |
|---|---|---|---|---|---|---|---|
| Standard | 33.72 | 34.74 | 35.58 | 36.60 | 37.44 | 38.46 | 39.30 |
| Camarilla | 35.90 | 36.07 | 36.24 | 36.41 | 36.58 | 36.75 | 36.92 |
| Woodie | 33.62 | 34.70 | 35.48 | 36.56 | 37.34 | 38.42 | 39.20 |
| Fibonacci | 34.74 | 35.45 | 35.89 | 36.60 | 37.31 | 37.75 | 38.46 |
| Pivot points | S3 | S2 | S1 | PP | R1 | R2 | R3 |
|---|---|---|---|---|---|---|---|
| Standard | 26.56 | 28.95 | 33.23 | 35.62 | 39.90 | 42.29 | 46.57 |
| Camarilla | 35.67 | 36.28 | 36.89 | 37.50 | 38.11 | 38.72 | 39.33 |
| Woodie | 27.50 | 29.42 | 34.17 | 36.09 | 40.84 | 42.76 | 47.51 |
| Fibonacci | 28.95 | 31.50 | 33.08 | 35.62 | 38.17 | 39.75 | 42.29 |
Numerical data
The following is the status of technical indicators and moving averages registered at the time this technical analysis was created:
| RSI (14): | 58.97 | |
| MACD (12,26,9): | 0.8100 | |
| Directional Movement: | 20.30 | |
| AROON (14): | -21.43 | |
| DEMA (21): | 37.06 | |
| Parabolic SAR (0,02-0,02-0,2): | 37.72 | |
| Elder Ray (13): | 0.31 | |
| Super Trend (3,10): | 35.04 | |
| Zig ZAG (10): | 36.22 | |
| VORTEX (21): | 1.1100 | |
| Stochastique (14,3,5): | 23.38 | |
| TEMA (21): | 36.95 | |
| Williams %R (14): | -80.00 | |
| Chande Momentum Oscillator (20): | -1.23 | |
| Repulse (5,40,3): | -1.5300 | |
| ROCnROLL: | -1 | |
| TRIX (15,9): | 0.4700 | |
| Courbe Coppock: | 3.85 |
| MA7: | 36.23 | |
| MA20: | 36.21 | |
| MA50: | 33.44 | |
| MA100: | 32.13 | |
| MAexp7: | 36.33 | |
| MAexp20: | 35.85 | |
| MAexp50: | 34.25 | |
| MAexp100: | 33.15 | |
| Price / MA7: | -0.03% | |
| Price / MA20: | +0.03% | |
| Price / MA50: | +8.31% | |
| Price / MA100: | +12.73% | |
| Price / MAexp7: | -0.30% | |
| Price / MAexp20: | +1.03% | |
| Price / MAexp50: | +5.75% | |
| Price / MAexp100: | +9.26% |
News
Don"t forget to follow the news on ACI WORLDWIDE INC.. At the time of publication of this analysis, the latest news was as follows:
- ACI Worldwide’s Latest Release of ACI Speedpay Enriches Digital Bill Payment Options and Improves Customer Experience
- ACI Worldwide’s Darcy Locke Appointed Chair of American Financial Services Association Business Partner Board
- Mobile Apps Gain Popularity for Bill Payments Compared to Traditional Payment Methods, Reveals ACI Speedpay® Pulse Study
- ACI Worldwide, Inc. To Release Third Quarter 2019 Financial Results
- Digitally-Led Mid-Tier Merchants on Track to Win Global Innovation Race, Research by ACI Worldwide and Ovum Reveals
About author

Online


Add a comment
Comments
0 comments on the analysis ACI WORLDWIDE INC. - Daily