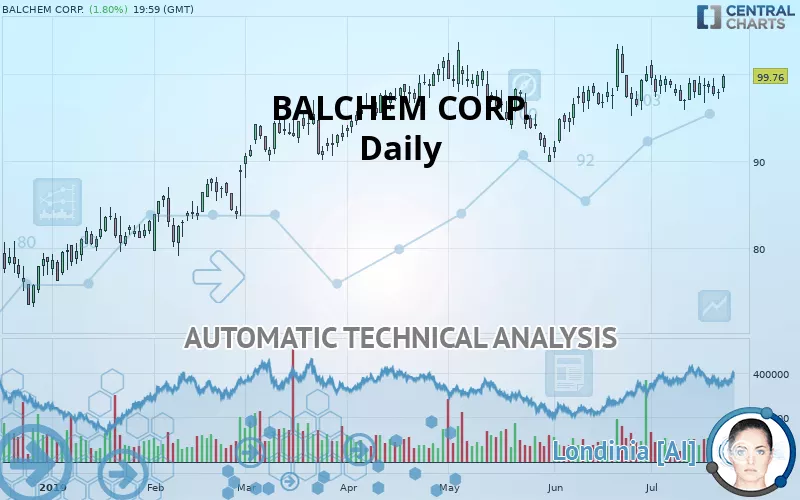
BALCHEM CORP. - Daily - Technical analysis published on 07/24/2019 (GMT)
- 233
- 0
- Who voted?
Click here for a new analysis!
- Timeframe : Daily
- - Analysis generated on
- Status : TARGET REACHED
Summary of the analysis

Additional analysis
Quotes
BALCHEM CORP. rating 99.76 USD. The price has increased by +1.80% since the last closing and was between 97.91 USD and 99.97 USD. This implies that the price is at +1.89% from its lowest and at -0.21% from its highest.A bullish gap was detected at the opening by the Central Gaps scanner. There are a lot of buyers and they have the upper hand in the very short term.
Opening Gap UP
Type : Bullish
Timeframe : Openning
So that you have an overall view of the price change, here is a table showing the variations over several periods:
Near a new HIGH record (1st january)
Type : Bullish
Timeframe : Weekly
Technical
Technical analysis of BALCHEM CORP. in Daily shows a strongly overall bullish trend. The signals given by the moving averages are 85.71% bullish. This strong bullish trend is confirmed by the strong signals currently being given by short-term moving averages. The Central Indicators scanner does not detect any result on moving averages that would impact this trend.
In fact, according to the parameters integrated into the Central Analyzer system, 11 technical indicators out of 18 analysed are currently bullish. Caution: the Central Indicators scanner currently detects an excess:
Williams %R indicator is overbought : over -20
Type : Neutral
Timeframe : Daily
Pivot points : price is over resistance 1
Type : Neutral
Timeframe : Weekly
Pivot points : price is over resistance 3
Type : Neutral
Timeframe : Daily
Price is back under the pivot point
Type : Bearish
Timeframe : Weekly
Williams %R indicator is back over -50
Type : Bullish
Timeframe : Daily
Central Patterns, the market scanner focusing on chart patterns, resistances and supports found these results:
Resistance of channel is broken
Type : Bullish
Timeframe : Daily
Resistance of triangle is broken
Type : Bullish
Timeframe : Daily
For a small rebound in the very short term, the Central Candlesticks scanner currently notes the presence of this bullish pattern in Japanese candlesticks:
Bullish harami
Type : Bullish
Timeframe : Daily
| S3 | S2 | S1 | Price | R1 | R2 | |
|---|---|---|---|---|---|---|
| ProTrendLines | 80.69 | 88.93 | 97.06 | 99.76 | 102.89 | 116.69 |
| Change (%) | -19.12% | -10.86% | -2.71% | - | +3.14% | +16.97% |
| Change | -19.07 | -10.83 | -2.70 | - | +3.13 | +16.93 |
| Level | Minor | Major | Major | - | Major | Major |
Pivot points can also be used to set your price objectives. Here is the price situation in relation to pivot points:
| Pivot points | S3 | S2 | S1 | PP | R1 | R2 | R3 |
|---|---|---|---|---|---|---|---|
| Standard | 96.23 | 96.71 | 97.35 | 97.83 | 98.47 | 98.95 | 99.59 |
| Camarilla | 97.69 | 97.80 | 97.90 | 98.00 | 98.10 | 98.21 | 98.31 |
| Woodie | 96.32 | 96.75 | 97.44 | 97.87 | 98.56 | 98.99 | 99.68 |
| Fibonacci | 96.71 | 97.14 | 97.40 | 97.83 | 98.26 | 98.52 | 98.95 |
| Pivot points | S3 | S2 | S1 | PP | R1 | R2 | R3 |
|---|---|---|---|---|---|---|---|
| Standard | 93.16 | 94.91 | 96.31 | 98.06 | 99.46 | 101.21 | 102.61 |
| Camarilla | 96.85 | 97.14 | 97.43 | 97.72 | 98.01 | 98.30 | 98.59 |
| Woodie | 93.00 | 94.82 | 96.15 | 97.97 | 99.30 | 101.12 | 102.45 |
| Fibonacci | 94.91 | 96.11 | 96.85 | 98.06 | 99.26 | 100.00 | 101.21 |
| Pivot points | S3 | S2 | S1 | PP | R1 | R2 | R3 |
|---|---|---|---|---|---|---|---|
| Standard | 79.19 | 84.74 | 92.36 | 97.91 | 105.53 | 111.08 | 118.70 |
| Camarilla | 96.35 | 97.56 | 98.76 | 99.97 | 101.18 | 102.38 | 103.59 |
| Woodie | 80.22 | 85.26 | 93.39 | 98.43 | 106.56 | 111.60 | 119.73 |
| Fibonacci | 84.74 | 89.77 | 92.88 | 97.91 | 102.94 | 106.05 | 111.08 |
Numerical data
The following are the details of the technical indicators and moving averages that were collected to generate this technical analysis:
| RSI (14): | 55.91 | |
| MACD (12,26,9): | 0.3400 | |
| Directional Movement: | 4.18 | |
| AROON (14): | 57.14 | |
| DEMA (21): | 98.80 | |
| Parabolic SAR (0,02-0,02-0,2): | 100.83 | |
| Elder Ray (13): | 0.46 | |
| Super Trend (3,10): | 93.67 | |
| Zig ZAG (10): | 99.76 | |
| VORTEX (21): | 0.9500 | |
| Stochastique (14,3,5): | 59.65 | |
| TEMA (21): | 98.76 | |
| Williams %R (14): | -5.12 | |
| Chande Momentum Oscillator (20): | 0.26 | |
| Repulse (5,40,3): | 2.0300 | |
| ROCnROLL: | 1 | |
| TRIX (15,9): | 0.0600 | |
| Courbe Coppock: | 0.45 |
| MA7: | 98.55 | |
| MA20: | 98.43 | |
| MA50: | 97.02 | |
| MA100: | 96.46 | |
| MAexp7: | 98.62 | |
| MAexp20: | 98.32 | |
| MAexp50: | 97.46 | |
| MAexp100: | 95.88 | |
| Price / MA7: | +1.23% | |
| Price / MA20: | +1.35% | |
| Price / MA50: | +2.82% | |
| Price / MA100: | +3.42% | |
| Price / MAexp7: | +1.16% | |
| Price / MAexp20: | +1.46% | |
| Price / MAexp50: | +2.36% | |
| Price / MAexp100: | +4.05% |
News
The last news published on BALCHEM CORP. at the time of the generation of this analysis was as follows:
- New Research: Key Drivers of Growth for Corcept Therapeutics, HubSpot, Tableau Software, Balchem, Steelcase, and Chimerix — Factors of Influence, Major Initiatives and Sustained Production
- Balchem Corporation to Host Earnings Call
- Investor Network: Balchem Corporation to Host Earnings Call
-
 Balchem
- Balchem Corporation Announces Dividend
About author

Online


Add a comment
Comments
0 comments on the analysis BALCHEM CORP. - Daily