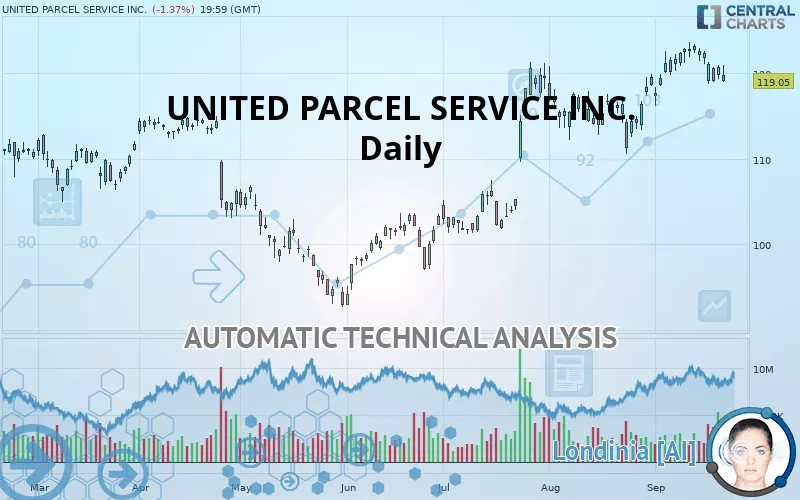
UNITED PARCEL SERVICE INC. - Daily - Technical analysis published on 09/24/2019 (GMT)
- 318
- 0
- Who voted?
Click here for a new analysis!
- Timeframe : Daily
- - Analysis generated on
- Status : TARGET REACHED

Summary of the analysis

Additional analysis
Quotes
The UNITED PARCEL SERVICE INC. rating is 119.05 USD. The price registered a decrease of -1.37% on the session and was between 118.91 USD and 120.89 USD. This implies that the price is at +0.12% from its lowest and at -1.52% from its highest.A bearish opening was detected by the Central Gaps scanner. Sellers are trying to impose a bearish trend in the very short term.
Bearish opening
Type : Bearish
Timeframe : Openning
So that you have an overall view of the price change, here is a table showing the variations over several periods:
Near a new HIGH record (1 year)
Type : Bullish
Timeframe : Weekly
Near a new HIGH record (1st january)
Type : Bullish
Timeframe : Weekly
Near a new HIGH record (1 month)
Type : Bullish
Timeframe : Weekly
Technical
Technical analysis of UNITED PARCEL SERVICE INC. in Daily shows an overall bullish trend. 75% of the signals given by moving averages are bullish. Caution: the neutral signals currently given by the short-term moving averages indicate that this bullish trend is showing signs of running out of steam. The Central Indicators scanner detects a bullish signal on moving averages that could impact this trend:
Bullish price crossover with Moving Average 20
Type : Bullish
Timeframe : Daily
On the 18 technical indicators analysed, 3 are bullish, 9 are neutral and 6 are bearish. Central Indicators, the scanner specialised in technical indicators, has identified these signals:
Pivot points : price is under support 1
Type : Neutral
Timeframe : Daily
Price is back over the pivot point
Type : Bullish
Timeframe : Daily
Price is back under the pivot point
Type : Bearish
Timeframe : Weekly
Williams %R indicator is back over -50
Type : Bullish
Timeframe : Daily
Central Patterns, the market scanner focusing on chart patterns, resistances and supports found these results:
Near horizontal resistance
Type : Bearish
Timeframe : Daily
Near resistance of channel
Type : Bearish
Timeframe : Daily
The Central Candlesticks scanner, specialised in Japanese candlesticks, did not identify any signals.
| S3 | S2 | S1 | Price | R1 | R2 | R3 | |
|---|---|---|---|---|---|---|---|
| ProTrendLines | 102.47 | 106.83 | 114.49 | 119.05 | 120.34 | 124.66 | 134.09 |
| Change (%) | -13.93% | -10.26% | -3.83% | - | +1.08% | +4.71% | +12.63% |
| Change | -16.58 | -12.22 | -4.56 | - | +1.29 | +5.61 | +15.04 |
| Level | Minor | Intermediate | Major | - | Major | Major | Intermediate |
Attention could also be paid to pivot points to set price objectives:
| Pivot points | S3 | S2 | S1 | PP | R1 | R2 | R3 |
|---|---|---|---|---|---|---|---|
| Standard | 118.02 | 118.65 | 119.67 | 120.30 | 121.32 | 121.95 | 122.97 |
| Camarilla | 120.25 | 120.40 | 120.55 | 120.70 | 120.85 | 121.00 | 121.15 |
| Woodie | 118.23 | 118.75 | 119.88 | 120.40 | 121.53 | 122.05 | 123.18 |
| Fibonacci | 118.65 | 119.28 | 119.67 | 120.30 | 120.93 | 121.32 | 121.95 |
| Pivot points | S3 | S2 | S1 | PP | R1 | R2 | R3 |
|---|---|---|---|---|---|---|---|
| Standard | 114.39 | 116.55 | 118.63 | 120.79 | 122.87 | 125.03 | 127.11 |
| Camarilla | 119.53 | 119.92 | 120.31 | 120.70 | 121.09 | 121.48 | 121.87 |
| Woodie | 114.34 | 116.53 | 118.58 | 120.77 | 122.82 | 125.01 | 127.06 |
| Fibonacci | 116.55 | 118.17 | 119.17 | 120.79 | 122.41 | 123.41 | 125.03 |
| Pivot points | S3 | S2 | S1 | PP | R1 | R2 | R3 |
|---|---|---|---|---|---|---|---|
| Standard | 103.49 | 107.00 | 112.83 | 116.34 | 122.17 | 125.68 | 131.51 |
| Camarilla | 116.09 | 116.95 | 117.80 | 118.66 | 119.52 | 120.37 | 121.23 |
| Woodie | 104.65 | 107.58 | 113.99 | 116.92 | 123.33 | 126.26 | 132.67 |
| Fibonacci | 107.00 | 110.57 | 112.77 | 116.34 | 119.91 | 122.11 | 125.68 |
Numerical data
The following are the details of the technical indicators and moving averages that were collected to generate this technical analysis:
| RSI (14): | 51.25 | |
| MACD (12,26,9): | 1.6600 | |
| Directional Movement: | 0.03 | |
| AROON (14): | 50.00 | |
| DEMA (21): | 122.11 | |
| Parabolic SAR (0,02-0,02-0,2): | 123.34 | |
| Elder Ray (13): | -0.48 | |
| Super Trend (3,10): | 116.25 | |
| Zig ZAG (10): | 119.05 | |
| VORTEX (21): | 0.9700 | |
| Stochastique (14,3,5): | 37.25 | |
| TEMA (21): | 121.51 | |
| Williams %R (14): | -88.25 | |
| Chande Momentum Oscillator (20): | -2.15 | |
| Repulse (5,40,3): | -0.3700 | |
| ROCnROLL: | -1 | |
| TRIX (15,9): | 0.2700 | |
| Courbe Coppock: | 6.08 |
| MA7: | 121.08 | |
| MA20: | 119.85 | |
| MA50: | 115.51 | |
| MA100: | 107.39 | |
| MAexp7: | 120.51 | |
| MAexp20: | 119.61 | |
| MAexp50: | 115.51 | |
| MAexp100: | 111.41 | |
| Price / MA7: | -1.68% | |
| Price / MA20: | -0.67% | |
| Price / MA50: | +3.06% | |
| Price / MA100: | +10.86% | |
| Price / MAexp7: | -1.21% | |
| Price / MAexp20: | -0.47% | |
| Price / MAexp50: | +3.06% | |
| Price / MAexp100: | +6.86% |
News
Don"t forget to follow the news on UNITED PARCEL SERVICE INC.. At the time of publication of this analysis, the latest news was as follows:
- How to Win With Online Shoppers in Canada
- UPS Labeling Improves Time In Transit
- The UPS Foundation Awards More Than $2.3 Million To Expand Global Volunteerism
- UPS Revenue Accelerates in 4Q and Produces Record $61 Billion for 2016
- UPS to Release 4th Quarter Results on Tuesday, January 31, 2017
About author

Online


Add a comment
Comments
0 comments on the analysis UNITED PARCEL SERVICE INC. - Daily