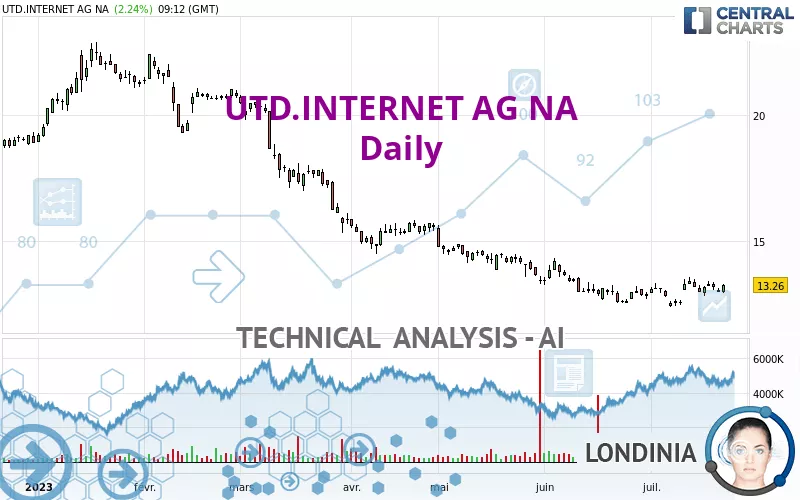
UTD.INTERNET AG NA - Daily - Technical analysis published on 07/24/2023 (GMT)
- 190
- 0
Click here for a new analysis!
- Timeframe : Daily
- - Analysis generated on
- Status : INVALID
Summary of the analysis

Additional analysis
Quotes
The UTD.INTERNET AG NA price is 13.26 EUR. On the day, this instrument gained +2.24% with the lowest point at 12.95 EUR and the highest point at 13.30 EUR. The deviation from the price is +2.39% for the low point and -0.30% for the high point.A bearish gap was detected at the opening by the Central Gaps scanner. There are a lot of sellers and they have the upper hand in the very short term.
Opening Gap DOWN
Type : Bearish
Timeframe : Openning
So that you have an overall view of the price change, here is a table showing the variations over several periods:
Near a new LOW record (5 years)
Type : Bearish
Timeframe : Weekly
Near a new LOW record (1 year)
Type : Bearish
Timeframe : Weekly
Near a new LOW record (1st january)
Type : Bearish
Timeframe : Weekly
Near a new LOW record (1 month)
Type : Bearish
Timeframe : Weekly
Technical
Technical analysis of this Daily chart of UTD.INTERNET AG NA indicates that the overall trend is bearish. 71.43% of the signals given by moving averages are bearish. Caution: the neutral signals currently given by short-term moving averages show us that the global trend is losing momentum. The Central Indicators market scanner is currently detecting a bullish signal that could impact this trend:
Bullish price crossover with Moving Average 20
Type : Bullish
Timeframe : Daily
The probability of a further increase are moderate given the direction of the technical indicators.
Central Indicators, the detector scanner for these technical indicators has recently detected several signals:
Pivot points : price is over resistance 2
Type : Neutral
Timeframe : Daily
RSI indicator is back over 50
Type : Bullish
Timeframe : Daily
Price is back over the pivot point
Type : Bullish
Timeframe : Weekly
Momentum indicator is back over 0
Type : Bullish
Timeframe : Daily
No signals are given by Central Patterns, a market scanner specialised in chart patterns, resistances and supports.
Central Candlesticks, the scanner specialised in Japanese candlesticks, detects a bullish signal that could support the hypothesis of a small rebound in the very short term:
Bullish engulfing lines
Type : Bullish
Timeframe : Daily
| S3 | S2 | S1 | Price | R1 | R2 | R3 | |
|---|---|---|---|---|---|---|---|
| ProTrendLines | 3.86 | 11.12 | 12.55 | 13.26 | 13.40 | 15.15 | 17.50 |
| Change (%) | -70.89% | -16.14% | -5.35% | - | +1.06% | +14.25% | +31.98% |
| Change | -9.40 | -2.14 | -0.71 | - | +0.14 | +1.89 | +4.24 |
| Level | Minor | Intermediate | Major | - | Intermediate | Minor | Minor |
Pivot points can also be used to set your price objectives. Here is the price situation in relation to pivot points:
| Pivot points | S3 | S2 | S1 | PP | R1 | R2 | R3 |
|---|---|---|---|---|---|---|---|
| Standard | 12.73 | 12.85 | 12.91 | 13.03 | 13.09 | 13.21 | 13.27 |
| Camarilla | 12.92 | 12.94 | 12.95 | 12.97 | 12.99 | 13.00 | 13.02 |
| Woodie | 12.70 | 12.84 | 12.88 | 13.02 | 13.06 | 13.20 | 13.24 |
| Fibonacci | 12.85 | 12.92 | 12.96 | 13.03 | 13.10 | 13.14 | 13.21 |
| Pivot points | S3 | S2 | S1 | PP | R1 | R2 | R3 |
|---|---|---|---|---|---|---|---|
| Standard | 12.10 | 12.46 | 12.71 | 13.07 | 13.32 | 13.68 | 13.93 |
| Camarilla | 12.80 | 12.86 | 12.91 | 12.97 | 13.03 | 13.08 | 13.14 |
| Woodie | 12.06 | 12.43 | 12.67 | 13.04 | 13.28 | 13.65 | 13.89 |
| Fibonacci | 12.46 | 12.69 | 12.83 | 13.07 | 13.30 | 13.44 | 13.68 |
| Pivot points | S3 | S2 | S1 | PP | R1 | R2 | R3 |
|---|---|---|---|---|---|---|---|
| Standard | 10.40 | 11.46 | 12.18 | 13.24 | 13.96 | 15.02 | 15.74 |
| Camarilla | 12.41 | 12.57 | 12.74 | 12.90 | 13.06 | 13.23 | 13.39 |
| Woodie | 10.23 | 11.38 | 12.01 | 13.16 | 13.79 | 14.94 | 15.57 |
| Fibonacci | 11.46 | 12.14 | 12.56 | 13.24 | 13.92 | 14.34 | 15.02 |
Numerical data
The following is the status of the technical indicators and moving averages at the time of publication of this technical analysis:
| RSI (14): | 52.62 | |
| MACD (12,26,9): | -0.0300 | |
| Directional Movement: | 0.48 | |
| AROON (14): | 28.57 | |
| DEMA (21): | 13.01 | |
| Parabolic SAR (0,02-0,02-0,2): | 12.69 | |
| Elder Ray (13): | 0.04 | |
| Super Trend (3,10): | 13.44 | |
| Zig ZAG (10): | 13.25 | |
| VORTEX (21): | 0.9600 | |
| Stochastique (14,3,5): | 64.41 | |
| TEMA (21): | 13.20 | |
| Williams %R (14): | -26.27 | |
| Chande Momentum Oscillator (20): | 0.44 | |
| Repulse (5,40,3): | 1.4700 | |
| ROCnROLL: | -1 | |
| TRIX (15,9): | -0.0900 | |
| Courbe Coppock: | 3.69 |
| MA7: | 13.14 | |
| MA20: | 13.02 | |
| MA50: | 13.33 | |
| MA100: | 14.56 | |
| MAexp7: | 13.13 | |
| MAexp20: | 13.08 | |
| MAexp50: | 13.50 | |
| MAexp100: | 14.66 | |
| Price / MA7: | +0.91% | |
| Price / MA20: | +1.84% | |
| Price / MA50: | -0.53% | |
| Price / MA100: | -8.93% | |
| Price / MAexp7: | +0.99% | |
| Price / MAexp20: | +1.38% | |
| Price / MAexp50: | -1.78% | |
| Price / MAexp100: | -9.55% |
News
Don't forget to follow the news on UTD.INTERNET AG NA. At the time of publication of this analysis, the latest news was as follows:
- EQS-News: United Internet gets off to good start in 2023
- EQS-Adhoc: United Internet with successful fiscal year 2022
- EQS-News: United Internet AG: Change in Management Board of United Internet AG
- EQS-News: United Internet acquires 13.9 million treasury shares during its public share buyback offer
- EQS-Adhoc: United Internet AG: Resolutions to reduce capital by cancelling own shares and to make a public share buyback offer
About author
Online


Add a comment
Comments
0 comments on the analysis UTD.INTERNET AG NA - Daily