| Open: | - |
| Change: | - |
| Volume: | - |
| Low: | - |
| High: | - |
| High / Low range: | - |
| Type: | Stocks |
| Ticker: | UAL |
| ISIN: |
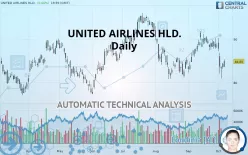
UNITED AIRLINES HLD. - Daily - Technical analysis published on 10/07/2019 (GMT)
- 328
- 0
- 10/07/2019 - 21:39
- Who voted?
Click here for a new analysis!
- Timeframe : Daily
- - Analysis generated on 10/07/2019 - 21:38
- Status : TARGET REACHED

Summary of the analysis

Additional analysis
Quotes
The UNITED AIRLINES HLD. price is 84.85 USD. The price registered an increase of +0.66% on the session and was traded between 83.61 USD and 85.26 USD over the period. The price is currently at +1.48% from its lowest and -0.48% from its highest.A bearish opening was detected by the Central Gaps scanner. Sellers are trying to impose a bearish trend in the very short term.
Bearish opening
Type : Bearish
Timeframe : Openning
Here is a more detailed summary of the historical variations registered by UNITED AIRLINES HLD.:
Near a new LOW record (1 month)
Type : Bearish
Timeframe : Weekly
Technical
A technical analysis in Daily of this UNITED AIRLINES HLD. chart shows a bearish trend. The signals given by moving averages are 71.43% bearish. This bearish trend is reinforced by the strong signals currently being given by short-term moving averages. There is no crossing of moving average by the price or crossing of moving averages between themselves.
An assessment of technical indicators does not currently provide any relevant information to suggest whether the signal given by the technical indicators is more bullish or bearish.
But beware of excesses. The Central Indicators scanner currently detects this:
CCI indicator is oversold : under -100
Type : Neutral
Timeframe : Daily
Previous candle closed under Bollinger bands
Type : Neutral
Timeframe : Daily
Pivot points : price is over resistance 1
Type : Neutral
Timeframe : Daily
Price is back under the pivot point
Type : Bearish
Timeframe : Weekly
An analysis of the price chart with the Central Patterns scanner (detector of chart patterns and resistances and supports) shows a result that can have an impact on the price change:
Horizontal resistance is broken
Type : Bullish
Timeframe : Daily
For a small rebound in the very short term, the Central Candlesticks scanner currently notes the presence of this bullish pattern in Japanese candlesticks:
White morning star
Type : Bullish
Timeframe : Daily
| S3 | S2 | S1 | Price | R1 | R2 | R3 | |
|---|---|---|---|---|---|---|---|
| ProTrendLines | 79.92 | 82.03 | 84.20 | 84.85 | 88.21 | 89.68 | 91.35 |
| Change (%) | -5.81% | -3.32% | -0.77% | - | +3.96% | +5.69% | +7.66% |
| Change | -4.93 | -2.82 | -0.65 | - | +3.36 | +4.83 | +6.50 |
| Level | Minor | Major | Intermediate | - | Intermediate | Major | Intermediate |
Pivot points can also be used to set your price objectives. Here is the price situation in relation to pivot points:
| Pivot points | S3 | S2 | S1 | PP | R1 | R2 | R3 |
|---|---|---|---|---|---|---|---|
| Standard | 82.10 | 82.61 | 83.45 | 83.96 | 84.80 | 85.31 | 86.15 |
| Camarilla | 83.92 | 84.04 | 84.17 | 84.29 | 84.41 | 84.54 | 84.66 |
| Woodie | 82.27 | 82.69 | 83.62 | 84.04 | 84.97 | 85.39 | 86.32 |
| Fibonacci | 82.61 | 83.13 | 83.44 | 83.96 | 84.48 | 84.79 | 85.31 |
| Pivot points | S3 | S2 | S1 | PP | R1 | R2 | R3 |
|---|---|---|---|---|---|---|---|
| Standard | 70.72 | 75.80 | 80.04 | 85.12 | 89.36 | 94.44 | 98.68 |
| Camarilla | 81.73 | 82.58 | 83.44 | 84.29 | 85.14 | 86.00 | 86.85 |
| Woodie | 70.31 | 75.59 | 79.63 | 84.91 | 88.95 | 94.23 | 98.27 |
| Fibonacci | 75.80 | 79.36 | 81.56 | 85.12 | 88.68 | 90.88 | 94.44 |
| Pivot points | S3 | S2 | S1 | PP | R1 | R2 | R3 |
|---|---|---|---|---|---|---|---|
| Standard | 73.57 | 77.91 | 83.16 | 87.50 | 92.75 | 97.09 | 102.34 |
| Camarilla | 85.77 | 86.65 | 87.53 | 88.41 | 89.29 | 90.17 | 91.05 |
| Woodie | 74.03 | 78.14 | 83.62 | 87.73 | 93.21 | 97.32 | 102.80 |
| Fibonacci | 77.91 | 81.57 | 83.84 | 87.50 | 91.16 | 93.43 | 97.09 |
Numerical data
The following is the status of the technical indicators and moving averages at the time of publication of this technical analysis:
| RSI (14): | 42.29 | |
| MACD (12,26,9): | -0.5400 | |
| Directional Movement: | -3.85 | |
| AROON (14): | -85.71 | |
| DEMA (21): | 86.29 | |
| Parabolic SAR (0,02-0,02-0,2): | 89.13 | |
| Elder Ray (13): | -1.95 | |
| Super Trend (3,10): | 89.33 | |
| Zig ZAG (10): | 84.85 | |
| VORTEX (21): | 0.8900 | |
| Stochastique (14,3,5): | 32.28 | |
| TEMA (21): | 85.70 | |
| Williams %R (14): | -59.18 | |
| Chande Momentum Oscillator (20): | -4.57 | |
| Repulse (5,40,3): | 1.5700 | |
| ROCnROLL: | 2 | |
| TRIX (15,9): | 0.0300 | |
| Courbe Coppock: | 7.73 |
| MA7: | 85.78 | |
| MA20: | 87.94 | |
| MA50: | 86.61 | |
| MA100: | 86.66 | |
| MAexp7: | 85.52 | |
| MAexp20: | 86.72 | |
| MAexp50: | 86.98 | |
| MAexp100: | 86.80 | |
| Price / MA7: | -1.08% | |
| Price / MA20: | -3.51% | |
| Price / MA50: | -2.03% | |
| Price / MA100: | -2.09% | |
| Price / MAexp7: | -0.78% | |
| Price / MAexp20: | -2.16% | |
| Price / MAexp50: | -2.45% | |
| Price / MAexp100: | -2.25% |
News
The latest news and videos published on UNITED AIRLINES HLD. at the time of the analysis were as follows:
-
08/31/2018 - 20:22
 United Continental Raises Checked Bag Fees To Combat Rising Fuel Costs
-
07/18/2018 - 19:13
United Continental Posts Strong Quarterly Earnings Report
- 06/12/2018 - 12:15 Detailed Research: Economic Perspectives on Southern, AcelRx Pharmaceuticals, International Flavors & Fragrances, Pandora Media, Express Scripts Holding, and United Continental — What Drives Growth in Today's Competitive Landscape
- 03/08/2018 - 22:05 United Continental Holdings Elects Michele J. Hooper to Board of Directors
- 11/13/2017 - 22:00 United Continental Holdings, Inc. Recommends Shareholders Reject "Mini-Tender" Offer by TRC Capital Corporation
About author

Online


Add a comment
Comments
0 comments on the analysis UNITED AIRLINES HLD. - Daily