| Open: | 1.17 |
| Change: | -0.05 |
| Volume: | 0 |
| Low: | 1.11 |
| High: | 1.17 |
| High / Low range: | 0.06 |
| Type: | Stocks |
| Ticker: | UNP |
| ISIN: |
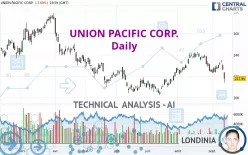
UNION PACIFIC CORP. - Daily - Technical analysis published on 09/15/2022 (GMT)
- 229
- 0
- 09/15/2022 - 11:00
Click here for a new analysis!
- Timeframe : Daily
- - Analysis generated on 09/15/2022 - 11:00
- Status : TARGET REACHED

Summary of the analysis

Additional analysis
Quotes
The UNION PACIFIC CORP. price is 217.95 USD. The price is lower by -3.69% since the last closing and was traded between 214.01 USD and 223.88 USD over the period. The price is currently at +1.84% from its lowest and -2.65% from its highest.The Central Gaps scanner detects a bearish gap which is a sign that the sellers have taken the lead in the very short term.
Opening Gap DOWN
Type : Bearish
Timeframe : Openning
Here is a more detailed summary of the historical variations registered by UNION PACIFIC CORP.:
New LOW record (1 month)
Type : Bearish
Timeframe : Weekly
Technical
Technical analysis of UNION PACIFIC CORP. in Daily shows an overall bearish trend. 64.29% of the signals given by moving averages are bearish. The overall trend is reinforced by the strong bearish signals from short-term moving averages. An assessment of moving averages reveals several bearish signals that could impact this trend:
Bearish trend reversal : adaptative moving average 20
Type : Bearish
Timeframe : Daily
Bearish trend reversal : adaptative moving average 50
Type : Bearish
Timeframe : Daily
Bearish trend reversal : adaptative moving average 100
Type : Bearish
Timeframe : Daily
Bearish price crossover with Moving Average 50
Type : Bearish
Timeframe : Daily
Bearish price crossover with Moving Average 100
Type : Bearish
Timeframe : Daily
Bearish price crossover with adaptative moving average 50
Type : Bearish
Timeframe : Daily
An assessment of technical indicators shows a bearish signal.
Caution: the Central Indicators scanner currently detects an excess:
CCI indicator is oversold : under -100
Type : Neutral
Timeframe : Daily
Williams %R indicator is oversold : under -80
Type : Neutral
Timeframe : Daily
Pivot points : price is under support 3
Type : Neutral
Timeframe : Daily
Pivot points : price is under support 3
Type : Neutral
Timeframe : Weekly
Parabolic SAR indicator bearish reversal
Type : Bearish
Timeframe : Daily
MACD indicator is back under 0
Type : Bearish
Timeframe : Daily
An analysis of the price chart with the Central Patterns scanner (detector of chart patterns and resistances and supports) shows several results that can have an impact on the price change:
Near horizontal support
Type : Bullish
Timeframe : Daily
Support of channel is broken
Type : Bearish
Timeframe : Daily
For a small setback in the very short term, the Central Candlesticks scanner currently notes the presence of this bearish pattern in Japanese candlesticks:
Downside gap
Type : Bearish
Timeframe : Daily
| S3 | S2 | S1 | Price | R1 | R2 | R3 | |
|---|---|---|---|---|---|---|---|
| ProTrendLines | 191.88 | 204.67 | 214.46 | 217.95 | 222.39 | 234.39 | 250.61 |
| Change (%) | -11.96% | -6.09% | -1.60% | - | +2.04% | +7.54% | +14.99% |
| Change | -26.07 | -13.28 | -3.49 | - | +4.44 | +16.44 | +32.66 |
| Level | Minor | Major | Intermediate | - | Major | Major | Intermediate |
Pivot points can also be used to set your price objectives. Here is the price situation in relation to pivot points:
| Pivot points | S3 | S2 | S1 | PP | R1 | R2 | R3 |
|---|---|---|---|---|---|---|---|
| Standard | 203.48 | 208.74 | 213.35 | 218.61 | 223.22 | 228.48 | 233.09 |
| Camarilla | 215.24 | 216.14 | 217.05 | 217.95 | 218.86 | 219.76 | 220.66 |
| Woodie | 203.15 | 208.58 | 213.02 | 218.45 | 222.89 | 228.32 | 232.76 |
| Fibonacci | 208.74 | 212.51 | 214.84 | 218.61 | 222.38 | 224.71 | 228.48 |
| Pivot points | S3 | S2 | S1 | PP | R1 | R2 | R3 |
|---|---|---|---|---|---|---|---|
| Standard | 216.05 | 219.77 | 225.83 | 229.55 | 235.61 | 239.33 | 245.39 |
| Camarilla | 229.19 | 230.09 | 230.98 | 231.88 | 232.78 | 233.67 | 234.57 |
| Woodie | 217.21 | 220.36 | 226.99 | 230.14 | 236.77 | 239.92 | 246.55 |
| Fibonacci | 219.77 | 223.51 | 225.82 | 229.55 | 233.29 | 235.60 | 239.33 |
| Pivot points | S3 | S2 | S1 | PP | R1 | R2 | R3 |
|---|---|---|---|---|---|---|---|
| Standard | 195.53 | 207.92 | 216.21 | 228.60 | 236.89 | 249.28 | 257.57 |
| Camarilla | 218.82 | 220.72 | 222.61 | 224.51 | 226.41 | 228.30 | 230.20 |
| Woodie | 193.49 | 206.90 | 214.17 | 227.58 | 234.85 | 248.26 | 255.53 |
| Fibonacci | 207.92 | 215.82 | 220.70 | 228.60 | 236.50 | 241.38 | 249.28 |
Numerical data
The following are the details of the technical indicators and moving averages that were collected to generate this technical analysis:
| RSI (14): | 36.79 | |
| MACD (12,26,9): | -0.4100 | |
| Directional Movement: | -19.97 | |
| AROON (14): | -92.86 | |
| DEMA (21): | 229.07 | |
| Parabolic SAR (0,02-0,02-0,2): | 235.29 | |
| Elder Ray (13): | -9.25 | |
| Super Trend (3,10): | 234.85 | |
| Zig ZAG (10): | 217.95 | |
| VORTEX (21): | 0.7600 | |
| Stochastique (14,3,5): | 36.28 | |
| TEMA (21): | 226.15 | |
| Williams %R (14): | -84.09 | |
| Chande Momentum Oscillator (20): | -12.02 | |
| Repulse (5,40,3): | -3.4900 | |
| ROCnROLL: | 2 | |
| TRIX (15,9): | 0.0700 | |
| Courbe Coppock: | 7.71 |
| MA7: | 228.20 | |
| MA20: | 231.13 | |
| MA50: | 224.16 | |
| MA100: | 221.87 | |
| MAexp7: | 226.65 | |
| MAexp20: | 228.68 | |
| MAexp50: | 226.60 | |
| MAexp100: | 226.50 | |
| Price / MA7: | -4.49% | |
| Price / MA20: | -5.70% | |
| Price / MA50: | -2.77% | |
| Price / MA100: | -1.77% | |
| Price / MAexp7: | -3.84% | |
| Price / MAexp20: | -4.69% | |
| Price / MAexp50: | -3.82% | |
| Price / MAexp100: | -3.77% |
News
Don't forget to follow the news on UNION PACIFIC CORP.. At the time of publication of this analysis, the latest news was as follows:
- 09/12/2022 - 15:00 Union Pacific Issues $600 Million in Green Bonds to Fund Investments Aimed at Reducing Carbon Footprint
- 08/31/2022 - 12:00 Union Pacific Corporation CEO Lance Fritz to Address the Cowen 2022 Global Transportation & Sustainable Mobility Conference
- 08/18/2022 - 18:57 New English and Spanish Lessons Aim to Make Rail Safety a Universal Language for Teachers, Students and Their Families
- 07/28/2022 - 20:10 Union Pacific Corporation Declares Third Quarter 2022 Dividend
- 07/27/2022 - 11:00 Union Pacific Signs Largest Locomotive Modernization Deal in Rail Industry History with Wabtec
About author

Online


Add a comment
Comments
0 comments on the analysis UNION PACIFIC CORP. - Daily