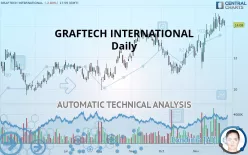
GRAFTECH INTERNATIONAL - Daily - Technical analysis published on 12/02/2019 (GMT)
- 187
- 0
- Who voted?
Click here for a new analysis!
- Timeframe : Daily
- - Analysis generated on
- Status : TARGET REACHED

Summary of the analysis

Additional analysis
Quotes
The GRAFTECH INTERNATIONAL price is 14.08 USD. The price is lower by -2.83% since the last closing and was between 14.00 USD and 14.37 USD. This implies that the price is at +0.57% from its lowest and at -2.02% from its highest.The Central Gaps scanner detects a bearish opening marking the presence of sellers ahead of buyers at the opening but not sufficiently marked to allow the price to register a quotation gap.
Bearish opening
Type : Bearish
Timeframe : Openning
A study of price movements over other periods shows the following variations:
Near a new HIGH record (1st january)
Type : Bullish
Timeframe : Weekly
Near a new HIGH record (1 month)
Type : Bullish
Timeframe : Weekly
Technical
A technical analysis in Daily of this GRAFTECH INTERNATIONAL chart shows a strongly bullish trend. 92.86% of the signals given by moving averages are bullish. The overall trend is supported by the strong bullish signals from short-term moving averages. The Central Indicators scanner does not detect any result on moving averages that would impact this trend.
An assessment of technical indicators shows a moderate bullish signal.
Central Indicators, the detector scanner for these technical indicators has recently detected several signals:
Pivot points : price is under support 1
Type : Neutral
Timeframe : Daily
Price is back over the pivot point
Type : Bullish
Timeframe : Daily
Price is back over the pivot point
Type : Bullish
Timeframe : Weekly
Central Patterns, the scanner specializing in chart patterns, did not identify any signals.
The Central Candlesticks scanner which studies Japanese candlesticks did not detect anything.
| S3 | S2 | S1 | Price | R1 | R2 | |
|---|---|---|---|---|---|---|
| ProTrendLines | 11.60 | 12.49 | 13.64 | 14.08 | 14.50 | 15.00 |
| Change (%) | -17.61% | -11.29% | -3.13% | - | +2.98% | +6.53% |
| Change | -2.48 | -1.59 | -0.44 | - | +0.42 | +0.92 |
| Level | Intermediate | Minor | Major | - | Major | Intermediate |
Pivot points can also be used to set your price objectives. Here is the price situation in relation to pivot points:
| Pivot points | S3 | S2 | S1 | PP | R1 | R2 | R3 |
|---|---|---|---|---|---|---|---|
| Standard | 13.67 | 13.83 | 14.16 | 14.33 | 14.66 | 14.82 | 15.15 |
| Camarilla | 14.35 | 14.40 | 14.45 | 14.49 | 14.54 | 14.58 | 14.63 |
| Woodie | 13.75 | 13.87 | 14.24 | 14.37 | 14.74 | 14.86 | 15.23 |
| Fibonacci | 13.83 | 14.02 | 14.14 | 14.33 | 14.52 | 14.63 | 14.82 |
| Pivot points | S3 | S2 | S1 | PP | R1 | R2 | R3 |
|---|---|---|---|---|---|---|---|
| Standard | 12.38 | 12.92 | 13.67 | 14.21 | 14.95 | 15.49 | 16.23 |
| Camarilla | 14.06 | 14.17 | 14.29 | 14.41 | 14.53 | 14.64 | 14.76 |
| Woodie | 12.49 | 12.98 | 13.77 | 14.26 | 15.05 | 15.54 | 16.33 |
| Fibonacci | 12.92 | 13.41 | 13.72 | 14.21 | 14.70 | 15.00 | 15.49 |
| Pivot points | S3 | S2 | S1 | PP | R1 | R2 | R3 |
|---|---|---|---|---|---|---|---|
| Standard | 8.77 | 9.82 | 10.91 | 11.97 | 13.06 | 14.12 | 15.21 |
| Camarilla | 11.41 | 11.61 | 11.81 | 12.00 | 12.20 | 12.40 | 12.59 |
| Woodie | 8.78 | 9.83 | 10.93 | 11.98 | 13.08 | 14.13 | 15.22 |
| Fibonacci | 9.82 | 10.64 | 11.15 | 11.97 | 12.79 | 13.30 | 14.12 |
Numerical data
The following is the status of technical indicators and moving averages registered at the time this technical analysis was created:
| RSI (14): | 57.83 | |
| MACD (12,26,9): | 0.5100 | |
| Directional Movement: | 9.25 | |
| AROON (14): | 57.14 | |
| DEMA (21): | 14.23 | |
| Parabolic SAR (0,02-0,02-0,2): | 13.05 | |
| Elder Ray (13): | 0.33 | |
| Super Trend (3,10): | 12.33 | |
| Zig ZAG (10): | 14.08 | |
| VORTEX (21): | 1.0700 | |
| Stochastique (14,3,5): | 82.40 | |
| TEMA (21): | 14.50 | |
| Williams %R (14): | -26.65 | |
| Chande Momentum Oscillator (20): | 0.41 | |
| Repulse (5,40,3): | 0.0400 | |
| ROCnROLL: | 1 | |
| TRIX (15,9): | 0.5400 | |
| Courbe Coppock: | 23.02 |
| MA7: | 14.18 | |
| MA20: | 13.48 | |
| MA50: | 12.67 | |
| MA100: | 12.15 | |
| MAexp7: | 14.12 | |
| MAexp20: | 13.58 | |
| MAexp50: | 12.92 | |
| MAexp100: | 12.47 | |
| Price / MA7: | -0.71% | |
| Price / MA20: | +4.45% | |
| Price / MA50: | +11.13% | |
| Price / MA100: | +15.88% | |
| Price / MAexp7: | -0.28% | |
| Price / MAexp20: | +3.68% | |
| Price / MAexp50: | +8.98% | |
| Price / MAexp100: | +12.91% |
News
Don"t forget to follow the news on GRAFTECH INTERNATIONAL. At the time of publication of this analysis, the latest news was as follows:
- GrafTech Announces Third Quarter 2019 Earnings Conference Call and Webcast
- GrafTech CEO to Present at the BMO Capital Markets Global Metals & Mining Conference
- GrafTech Reports Unaudited Full Year and Fourth Quarter 2018 Results
About author

Online


Add a comment
Comments
0 comments on the analysis GRAFTECH INTERNATIONAL - Daily