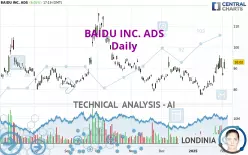
BAIDU INC. ADS - Daily - Technical analysis published on 02/04/2025 (GMT)
- 101
- 0
Click here for a new analysis!
- Timeframe : Daily
- - Analysis generated on
- Status : INVALID

Summary of the analysis

Additional analysis
Quotes
The BAIDU INC. ADS rating is 93.02 USD. On the day, this instrument gained +6.05% with the lowest point at 89.57 USD and the highest point at 94.27 USD. The deviation from the price is +3.85% for the low point and -1.33% for the high point.A bullish opening was detected by the Central Gaps scanner. Buyers are trying to impose a bullish momentum in the very short term.
Bullish opening
Type : Bullish
Timeframe : Openning
Here is a more detailed summary of the historical variations registered by BAIDU INC. ADS:
Near a new HIGH record (1st january)
Type : Bullish
Timeframe : Weekly
Near a new HIGH record (1 month)
Type : Bullish
Timeframe : Weekly
Technical
Technical analysis of BAIDU INC. ADS in Daily shows an overall bullish trend. The signals returned by the moving averages are 75.00% bullish. This bullish trend is reinforced by the strong signals currently being given by short-term moving averages. The Central Indicators scanner detects bullish signals on moving averages that could impact this trend:
Bullish price crossover with Moving Average 100
Type : Bullish
Timeframe : Daily
Bullish price crossover with adaptative moving average 50
Type : Bullish
Timeframe : Daily
Bullish price crossover with adaptative moving average 100
Type : Bullish
Timeframe : Daily
The probability of a further increase is high given the direction of the technical indicators.
But beware of excesses. The Central Indicators scanner currently detects this:
CCI indicator is overbought : over 100
Type : Neutral
Timeframe : Daily
Williams %R indicator is overbought : over -20
Type : Neutral
Timeframe : Daily
Pivot points : price is over resistance 2
Type : Neutral
Timeframe : Daily
Ichimoku : price is over the cloud
Type : Bullish
Timeframe : Daily
Price is back over the pivot point
Type : Bullish
Timeframe : Weekly
An analysis of the price chart with the Central Patterns scanner (detector of chart patterns and resistances and supports) shows a result that can have an impact on the price change:
Near horizontal resistance
Type : Bearish
Timeframe : Daily
For a small rebound in the very short term, the Central Candlesticks scanner currently notes the presence of this bullish pattern in Japanese candlesticks:
White morning star
Type : Bullish
Timeframe : Daily
| S3 | S2 | S1 | Price | R1 | R2 | R3 | |
|---|---|---|---|---|---|---|---|
| ProTrendLines | 77.43 | 83.60 | 90.21 | 93.02 | 93.73 | 100.67 | 108.66 |
| Change (%) | -16.76% | -10.13% | -3.02% | - | +0.76% | +8.22% | +16.81% |
| Change | -15.59 | -9.42 | -2.81 | - | +0.71 | +7.65 | +15.64 |
| Level | Major | Major | Major | - | Major | Intermediate | Minor |
To determine price objectives, it is also possible to use the pivot points. Here is the price position in relation to pivot points:
| Pivot points | S3 | S2 | S1 | PP | R1 | R2 | R3 |
|---|---|---|---|---|---|---|---|
| Standard | 81.90 | 84.21 | 85.96 | 88.27 | 90.02 | 92.33 | 94.08 |
| Camarilla | 86.59 | 86.97 | 87.34 | 87.71 | 88.08 | 88.45 | 88.83 |
| Woodie | 81.62 | 84.07 | 85.68 | 88.13 | 89.74 | 92.19 | 93.80 |
| Fibonacci | 84.21 | 85.76 | 86.72 | 88.27 | 89.82 | 90.78 | 92.33 |
| Pivot points | S3 | S2 | S1 | PP | R1 | R2 | R3 |
|---|---|---|---|---|---|---|---|
| Standard | 78.01 | 82.76 | 86.68 | 91.43 | 95.35 | 100.10 | 104.02 |
| Camarilla | 88.22 | 89.01 | 89.81 | 90.60 | 91.40 | 92.19 | 92.98 |
| Woodie | 77.60 | 82.55 | 86.27 | 91.22 | 94.94 | 99.89 | 103.61 |
| Fibonacci | 82.76 | 86.07 | 88.12 | 91.43 | 94.74 | 96.79 | 100.10 |
| Pivot points | S3 | S2 | S1 | PP | R1 | R2 | R3 |
|---|---|---|---|---|---|---|---|
| Standard | 60.81 | 69.00 | 79.80 | 87.99 | 98.79 | 106.98 | 117.78 |
| Camarilla | 85.38 | 87.12 | 88.86 | 90.60 | 92.34 | 94.08 | 95.82 |
| Woodie | 62.12 | 69.65 | 81.11 | 88.64 | 100.10 | 107.63 | 119.09 |
| Fibonacci | 69.00 | 76.25 | 80.74 | 87.99 | 95.24 | 99.73 | 106.98 |
Numerical data
The following is the status of the technical indicators and moving averages at the time of publication of this technical analysis:
| RSI (14): | 60.95 | |
| MACD (12,26,9): | 1.7600 | |
| Directional Movement: | 19.92 | |
| AROON (14): | 78.57 | |
| DEMA (21): | 88.96 | |
| Parabolic SAR (0,02-0,02-0,2): | 86.52 | |
| Elder Ray (13): | 3.56 | |
| Super Trend (3,10): | 83.51 | |
| Zig ZAG (10): | 93.62 | |
| VORTEX (21): | 0.9900 | |
| Stochastique (14,3,5): | 68.42 | |
| TEMA (21): | 91.23 | |
| Williams %R (14): | -15.20 | |
| Chande Momentum Oscillator (20): | 13.04 | |
| Repulse (5,40,3): | 3.8400 | |
| ROCnROLL: | 1 | |
| TRIX (15,9): | 0.0900 | |
| Courbe Coppock: | 24.05 |
| MA7: | 90.90 | |
| MA20: | 84.99 | |
| MA50: | 85.83 | |
| MA100: | 89.79 | |
| MAexp7: | 90.13 | |
| MAexp20: | 87.26 | |
| MAexp50: | 86.87 | |
| MAexp100: | 88.43 | |
| Price / MA7: | +2.33% | |
| Price / MA20: | +9.45% | |
| Price / MA50: | +8.38% | |
| Price / MA100: | +3.60% | |
| Price / MAexp7: | +3.21% | |
| Price / MAexp20: | +6.60% | |
| Price / MAexp50: | +7.08% | |
| Price / MAexp100: | +5.19% |
News
The last news published on BAIDU INC. ADS at the time of the generation of this analysis was as follows:
- Baidu to Report Fourth Quarter and Fiscal Year 2024 Financial Results on February 18, 2025
- Fangzhou Inc. Strengthens Partnerships with Tencent and Baidu, Unveiling its "AI Agent Solution"
- Baidu Announces Third Quarter 2024 Results
- Baidu Unveils iRAG and No-Code Tool Miaoda to Drive AI Application Boom
- Baidu to Report Third Quarter 2024 Financial Results on Nov 21, 2024
About author
Online


Add a comment
Comments
0 comments on the analysis BAIDU INC. ADS - Daily