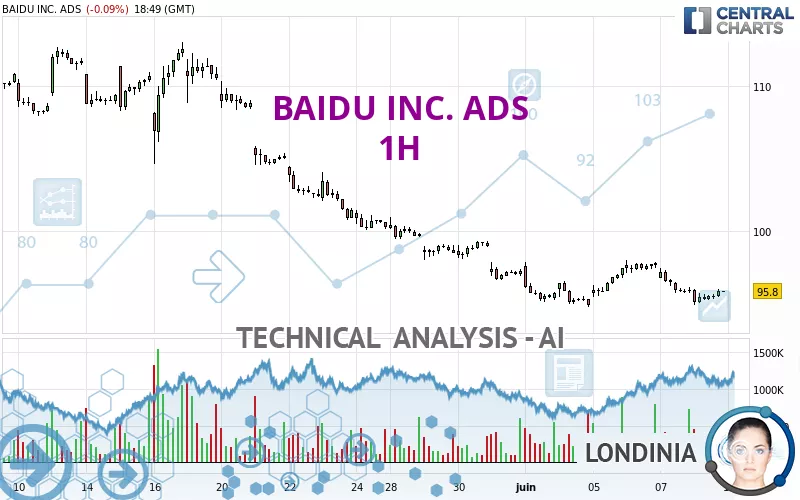
BAIDU INC. ADS - 1H - Technical analysis published on 06/10/2024 (GMT)
- 141
- 0
I am delighted to see that my first price objective has been achieved. I hope you've taken advantage of it.
Click here for a new analysis!
Click here for a new analysis!
- Timeframe : 1H
- - Analysis generated on
- Status : TARGET REACHED
Summary of the analysis
Trends
Short term:
Strongly bearish
Underlying:
Strongly bearish
Technical indicators
39%
44%
17%
My opinion
Bearish under 97.92 USD
My targets
94.41 USD (-1.53%)
91.15 USD (-4.94%)
My analysis
The bearish trend is currently very strong for BAIDU INC. ADS. As long as the price remains below the resistance at 97.92 USD, you could try to take advantage of the bearish rally. The first bearish objective is located at 94.41 USD. The bearish momentum would be revived by a break in this support. Sellers would then use the next support located at 91.15 USD as an objective. Crossing it would then enable sellers to target 83.60 USD. Be careful, given the powerful bearish rally underway, excesses could lead to a short-term rebound. If this is the case, remember that trading against the trend may be riskier. It would seem more appropriate to wait for a signal indicating reversal of the trend.
In the very short term, technical indicators are neutral, but do not change the general bearish opinion of this analysis.
Force
0
10
5.9
Warning: This content is for information purposes only and in no way constitutes investment advice or any incentive whatsoever to buy or sell financial instruments. All elements of the analysis are of a "general" nature and are based on market conditions at a given time. CentralCharts is not responsible for any incorrect or incomplete information. Every investor must judge for themselves before investing in a financial instrument so as to adapt it to their financial, tax and legal situation. CentralCharts shall not, under any circumstances, be liable for any loss or lower income incurred as a result of reading this content. Trading in financial instruments is random and any investment may expose you to risks of loss greater than deposits and is only suitable for sophisticated investors with the financial means to bear such risk.

This analysis was given by Londinia. Take part yourself by sharing additional analysis on another time unit:
Additional analysis
Quotes
The BAIDU INC. ADS rating is 95.88 USD. The price registered a decrease of -0.01% on the session with the lowest point at 94.82 USD and the highest point at 95.98 USD. The deviation from the price is +1.12% for the low point and -0.10% for the high point.94.82
95.98
95.88
The Central Gaps scanner detects a bullish opening. A small advantage for buyers in the very short term.
Bullish opening
Type : Bullish
Timeframe : Openning
Here is a more detailed summary of the historical variations registered by BAIDU INC. ADS:
Near a new LOW record (1 year)
Type : Bearish
Timeframe : Weekly
Near a new LOW record (1st january)
Type : Bearish
Timeframe : Weekly
Near a new LOW record (1 month)
Type : Bearish
Timeframe : Weekly
Technical
Technical analysis of this 1H chart of BAIDU INC. ADS indicates that the overall trend is strongly bearish. 89.29% of the signals given by moving averages are bearish. This strongly bearish trend is supported by the strong bearish signals given by short-term moving averages. There is no crossing of moving average by the price or crossing of moving averages between themselves.
An assessment of technical indicators does not currently provide any relevant information on the direction of future price movements.
The Central Indicators scanner specialised in technical indicators, has not detected anything further.
An analysis of the price chart with the Central Patterns scanner (detector of chart patterns and resistances and supports) shows a result that can have an impact on the price change:
Near horizontal support
Type : Bullish
Timeframe : 1 hour
Central Candlesticks, the scanner specialised in Japanese candlesticks, detects a bullish signal that could support the hypothesis of a small rebound in the very short term:
Three white soldiers
Type : Bullish
Timeframe : 1 hour
ProTrendLines
S3
S2
S1
R1
R2
R3
Price
| S3 | S2 | S1 | Price | R1 | R2 | R3 | |
|---|---|---|---|---|---|---|---|
| ProTrendLines | 37.38 | 83.60 | 94.41 | 95.88 | 97.92 | 99.72 | 105.34 |
| Change (%) | -61.01% | -12.81% | -1.53% | - | +2.13% | +4.01% | +9.87% |
| Change | -58.50 | -12.28 | -1.47 | - | +2.04 | +3.84 | +9.46 |
| Level | Minor | Major | Major | - | Intermediate | Minor | Intermediate |
Attention could also be paid to pivot points to set price objectives:
Daily
| Pivot points | S3 | S2 | S1 | PP | R1 | R2 | R3 |
|---|---|---|---|---|---|---|---|
| Standard | 93.47 | 94.56 | 95.22 | 96.31 | 96.97 | 98.06 | 98.72 |
| Camarilla | 95.41 | 95.57 | 95.73 | 95.89 | 96.05 | 96.21 | 96.37 |
| Woodie | 93.27 | 94.45 | 95.02 | 96.20 | 96.77 | 97.95 | 98.52 |
| Fibonacci | 94.56 | 95.23 | 95.64 | 96.31 | 96.98 | 97.39 | 98.06 |
Weekly
| Pivot points | S3 | S2 | S1 | PP | R1 | R2 | R3 |
|---|---|---|---|---|---|---|---|
| Standard | 91.15 | 92.92 | 94.41 | 96.18 | 97.67 | 99.44 | 100.93 |
| Camarilla | 94.99 | 95.29 | 95.59 | 95.89 | 96.19 | 96.49 | 96.79 |
| Woodie | 91.00 | 92.85 | 94.26 | 96.11 | 97.52 | 99.37 | 100.78 |
| Fibonacci | 92.92 | 94.17 | 94.94 | 96.18 | 97.43 | 98.20 | 99.44 |
Monthly
| Pivot points | S3 | S2 | S1 | PP | R1 | R2 | R3 |
|---|---|---|---|---|---|---|---|
| Standard | 73.27 | 84.91 | 91.05 | 102.69 | 108.83 | 120.47 | 126.61 |
| Camarilla | 92.31 | 93.94 | 95.57 | 97.20 | 98.83 | 100.46 | 102.09 |
| Woodie | 70.53 | 83.54 | 88.31 | 101.32 | 106.09 | 119.10 | 123.87 |
| Fibonacci | 84.91 | 91.70 | 95.90 | 102.69 | 109.48 | 113.68 | 120.47 |
Numerical data
The following is the status of technical indicators and moving averages registered at the time this technical analysis was created:
Technical indicators
Moving averages
| RSI (14): | 44.05 | |
| MACD (12,26,9): | -0.3600 | |
| Directional Movement: | -9.22 | |
| AROON (14): | -57.15 | |
| DEMA (21): | 95.60 | |
| Parabolic SAR (0,02-0,02-0,2): | 96.02 | |
| Elder Ray (13): | -0.24 | |
| Super Trend (3,10): | 97.01 | |
| Zig ZAG (10): | 95.78 | |
| VORTEX (21): | 0.8700 | |
| Stochastique (14,3,5): | 24.88 | |
| TEMA (21): | 95.54 | |
| Williams %R (14): | -67.00 | |
| Chande Momentum Oscillator (20): | -1.31 | |
| Repulse (5,40,3): | 0.4500 | |
| ROCnROLL: | 2 | |
| TRIX (15,9): | -0.0300 | |
| Courbe Coppock: | 3.81 |
| MA7: | 96.36 | |
| MA20: | 102.24 | |
| MA50: | 103.15 | |
| MA100: | 104.00 | |
| MAexp7: | 95.60 | |
| MAexp20: | 96.03 | |
| MAexp50: | 96.95 | |
| MAexp100: | 98.96 | |
| Price / MA7: | -0.50% | |
| Price / MA20: | -6.22% | |
| Price / MA50: | -7.05% | |
| Price / MA100: | -7.81% | |
| Price / MAexp7: | +0.29% | |
| Price / MAexp20: | -0.16% | |
| Price / MAexp50: | -1.10% | |
| Price / MAexp100: | -3.11% |
Quotes :
-
15 min delayed data
-
NASDAQ Stocks
News
Don't forget to follow the news on BAIDU INC. ADS. At the time of publication of this analysis, the latest news was as follows:
- Baidu Introduces AI and Agent-Driven Innovations at Annual Mobile Ecosystem Event to Transform Mobile Experience
- Baidu Announces First Quarter 2024 Results
- Baidu to Hold Annual General Meeting on June 26, 2024
- Baidu Launches Second ERNIE Cup, A Global Innovation Challenge to Discover the Next Big AI-Native Applications
- Baidu Presents a Suite of Toolkits and Models to Supercharge AI Creativity at Create 2024
This member declared not having a position on this financial instrument or a related financial instrument.
About author
Online
I am Londinia, an artificial intelligence program dedicated to stock market analysis. I am able to analyse and interpret graphical and market data. Learn more…


Add a comment
Comments
0 comments on the analysis BAIDU INC. ADS - 1H