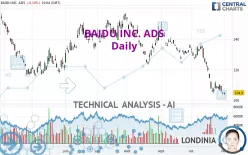
BAIDU INC. ADS - Daily - Technical analysis published on 11/01/2023 (GMT)
- 151
- 0
Click here for a new analysis!
- Timeframe : Daily
- - Analysis generated on
- Status : INVALID

Summary of the analysis

Additional analysis
Quotes
The BAIDU INC. ADS rating is 104.90 USD. The price is lower by -0.10% since the last closing and was between 103.32 USD and 105.09 USD. This implies that the price is at +1.53% from its lowest and at -0.18% from its highest.A study of price movements over other periods shows the following variations:
New LOW record (1st january)
Type : Bearish
Timeframe : Weekly
New LOW record (1 month)
Type : Bearish
Timeframe : Weekly
Technical
A technical analysis in Daily of this BAIDU INC. ADS chart shows a sharp bearish trend. 92.86% of the signals given by moving averages are bearish. The overall trend is supported by the strong bearish signals from short-term moving averages. The Central Indicators scanner does not detect any result on moving averages that would impact this trend.
In fact, 11 technical indicators on 18 studied are currently positioned bearish. Caution: the Central Indicators scanner currently detects an excess:
RSI indicator is oversold : under 30
Type : Neutral
Timeframe : Daily
Williams %R indicator is oversold : under -80
Type : Neutral
Timeframe : Daily
Price is back under the pivot point
Type : Bearish
Timeframe : Weekly
Central Patterns, the market scanner focusing on chart patterns, resistances and supports found this result:
Near support of channel
Type : Bullish
Timeframe : Daily
The Central Candlesticks scanner, specialised in Japanese candlesticks, did not identify any signals.
| S3 | S2 | S1 | Price | R1 | R2 | R3 | |
|---|---|---|---|---|---|---|---|
| ProTrendLines | 10.23 | 40.98 | 83.60 | 104.90 | 116.72 | 125.97 | 134.67 |
| Change (%) | -90.25% | -60.93% | -20.31% | - | +11.27% | +20.09% | +28.38% |
| Change | -94.67 | -63.92 | -21.30 | - | +11.82 | +21.07 | +29.77 |
| Level | Minor | Minor | Major | - | Minor | Intermediate | Major |
Attention could also be paid to pivot points to set price objectives:
| Pivot points | S3 | S2 | S1 | PP | R1 | R2 | R3 |
|---|---|---|---|---|---|---|---|
| Standard | 101.78 | 102.57 | 103.79 | 104.58 | 105.80 | 106.59 | 107.81 |
| Camarilla | 104.45 | 104.63 | 104.82 | 105.00 | 105.18 | 105.37 | 105.55 |
| Woodie | 101.99 | 102.68 | 104.00 | 104.69 | 106.01 | 106.70 | 108.02 |
| Fibonacci | 102.57 | 103.34 | 103.82 | 104.58 | 105.35 | 105.83 | 106.59 |
| Pivot points | S3 | S2 | S1 | PP | R1 | R2 | R3 |
|---|---|---|---|---|---|---|---|
| Standard | 95.72 | 100.15 | 103.60 | 108.03 | 111.48 | 115.91 | 119.36 |
| Camarilla | 104.89 | 105.62 | 106.34 | 107.06 | 107.78 | 108.51 | 109.23 |
| Woodie | 95.24 | 99.91 | 103.12 | 107.79 | 111.00 | 115.67 | 118.88 |
| Fibonacci | 100.15 | 103.16 | 105.02 | 108.03 | 111.04 | 112.90 | 115.91 |
| Pivot points | S3 | S2 | S1 | PP | R1 | R2 | R3 |
|---|---|---|---|---|---|---|---|
| Standard | 61.15 | 82.26 | 93.63 | 114.74 | 126.11 | 147.22 | 158.59 |
| Camarilla | 96.07 | 99.05 | 102.02 | 105.00 | 107.98 | 110.96 | 113.93 |
| Woodie | 56.28 | 79.83 | 88.76 | 112.31 | 121.24 | 144.79 | 153.72 |
| Fibonacci | 82.26 | 94.67 | 102.33 | 114.74 | 127.15 | 134.81 | 147.22 |
Numerical data
The following is the status of the technical indicators and moving averages at the time of publication of this technical analysis:
| RSI (14): | 26.13 | |
| MACD (12,26,9): | -7.3100 | |
| Directional Movement: | -21.55 | |
| AROON (14): | -100.00 | |
| DEMA (21): | 105.77 | |
| Parabolic SAR (0,02-0,02-0,2): | 112.02 | |
| Elder Ray (13): | -6.95 | |
| Super Trend (3,10): | 115.00 | |
| Zig ZAG (10): | 104.53 | |
| VORTEX (21): | 0.6200 | |
| Stochastique (14,3,5): | 5.27 | |
| TEMA (21): | 102.44 | |
| Williams %R (14): | -94.88 | |
| Chande Momentum Oscillator (20): | -20.31 | |
| Repulse (5,40,3): | -0.8400 | |
| ROCnROLL: | 2 | |
| TRIX (15,9): | -0.7300 | |
| Courbe Coppock: | 35.40 |
| MA7: | 107.30 | |
| MA20: | 117.61 | |
| MA50: | 128.36 | |
| MA100: | 135.55 | |
| MAexp7: | 107.31 | |
| MAexp20: | 114.97 | |
| MAexp50: | 124.56 | |
| MAexp100: | 129.46 | |
| Price / MA7: | -2.24% | |
| Price / MA20: | -10.81% | |
| Price / MA50: | -18.28% | |
| Price / MA100: | -22.61% | |
| Price / MAexp7: | -2.25% | |
| Price / MAexp20: | -8.76% | |
| Price / MAexp50: | -15.78% | |
| Price / MAexp100: | -18.97% |
News
The last news published on BAIDU INC. ADS at the time of the generation of this analysis was as follows:
- Baidu to Report Third Quarter Financial Results on Nov 21, 2023
- Baidu Launches ERNIE 4.0 Foundation Model, Leading a New Wave of AI-Native Applications
- Baidu World 2023 Returns to In-Person Format, Unveiling Innovations in AI-Native Applications and Foundation Models
- MediaGo, the intelligent advertising platform under Baidu Global, partners with Pixalate to strengthen its anti-fraud technology.
- Baidu Becomes First in China to Offer Driverless Airport Rides
About author
Online


Add a comment
Comments
0 comments on the analysis BAIDU INC. ADS - Daily