UMICORE - Daily - Technical analysis published on 01/05/2024 (GMT)
- 185
- 0
- Timeframe : Daily
- - Analysis generated on
- Status : NEUTRAL
Summary of the analysis

Additional analysis
Quotes
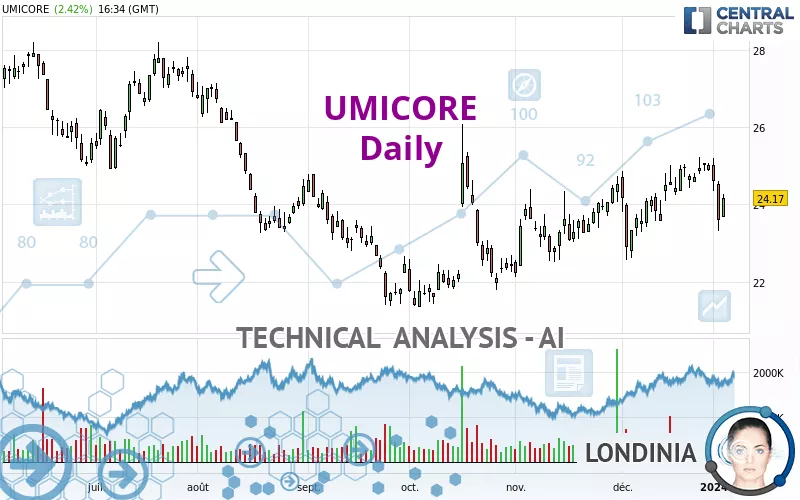
UMICORE rating 24.17 EUR. The price has increased by +2.42% since the last closing and was traded between 23.68 EUR and 24.26 EUR over the period. The price is currently at +2.07% from its lowest and -0.37% from its highest.A bullish opening was detected by the Central Gaps scanner. Buyers are trying to impose a bullish momentum in the very short term.
Bullish opening
Type : Bullish
Timeframe : Openning
A study of price movements over other periods shows the following variations:
Near a new HIGH record (1st january)
Type : Bullish
Timeframe : Weekly
Near a new LOW record (1 month)
Type : Bearish
Timeframe : Weekly
Technical
A technical analysis in Daily of this UMICORE chart shows a slightly bullish trend. 46.43% of the signals given by moving averages are bullish. As the signals currently given by short-term moving averages are rather neutral, the overall trend could quickly return to neutral as well. The Central Indicators market scanner is currently detecting several bearish and bullish signals that could impact this trend:
Bearish trend reversal : adaptative moving average 20
Type : Bearish
Timeframe : Daily
Bearish trend reversal : adaptative moving average 100
Type : Bearish
Timeframe : Daily
Bullish price crossover with Moving Average 50
Type : Bullish
Timeframe : Daily
Bullish price crossover with adaptative moving average 20
Type : Bullish
Timeframe : Daily
In fact, only 8 technical indicators out of 18 studied are currently positioned bearish. Central Indicators, the scanner specialised in technical indicators, has identified these signals:
Pivot points : price is under support 3
Type : Neutral
Timeframe : Weekly
Ichimoku : price is over the cloud
Type : Bullish
Timeframe : Daily
Price is back over the pivot point
Type : Bullish
Timeframe : Daily
Momentum indicator is back under 0
Type : Bearish
Timeframe : Daily
An analysis of the price chart with the Central Patterns scanner (detector of chart patterns and resistances and supports) shows a result that can have an impact on the price change:
Near resistance of triangle
Type : Bearish
Timeframe : Daily
Central Candlesticks, the scanner specialised in Japanese candlesticks, detects a bullish signal that could support the hypothesis of a small rebound in the very short term:
Bullish harami
Type : Bullish
Timeframe : Daily
| S3 | S2 | S1 | Price | R1 | R2 | R3 | |
|---|---|---|---|---|---|---|---|
| ProTrendLines | 21.39 | 22.23 | 23.25 | 24.17 | 24.60 | 25.73 | 27.64 |
| Change (%) | -11.50% | -8.03% | -3.81% | - | +1.78% | +6.45% | +14.36% |
| Change | -2.78 | -1.94 | -0.92 | - | +0.43 | +1.56 | +3.47 |
| Level | Intermediate | Minor | Major | - | Major | Minor | Minor |
Pivot points can also be used to set your price objectives. Here is the price situation in relation to pivot points:
| Pivot points | S3 | S2 | S1 | PP | R1 | R2 | R3 |
|---|---|---|---|---|---|---|---|
| Standard | 23.23 | 23.46 | 23.81 | 24.04 | 24.39 | 24.62 | 24.97 |
| Camarilla | 24.01 | 24.06 | 24.12 | 24.17 | 24.22 | 24.28 | 24.33 |
| Woodie | 23.30 | 23.49 | 23.88 | 24.07 | 24.46 | 24.65 | 25.04 |
| Fibonacci | 23.46 | 23.68 | 23.82 | 24.04 | 24.26 | 24.40 | 24.62 |
| Pivot points | S3 | S2 | S1 | PP | R1 | R2 | R3 |
|---|---|---|---|---|---|---|---|
| Standard | 24.28 | 24.54 | 24.72 | 24.98 | 25.16 | 25.42 | 25.60 |
| Camarilla | 24.78 | 24.82 | 24.86 | 24.90 | 24.94 | 24.98 | 25.02 |
| Woodie | 24.24 | 24.52 | 24.68 | 24.96 | 25.12 | 25.40 | 25.56 |
| Fibonacci | 24.54 | 24.71 | 24.81 | 24.98 | 25.15 | 25.25 | 25.42 |
| Pivot points | S3 | S2 | S1 | PP | R1 | R2 | R3 |
|---|---|---|---|---|---|---|---|
| Standard | 20.56 | 21.57 | 23.23 | 24.24 | 25.90 | 26.91 | 28.57 |
| Camarilla | 24.17 | 24.41 | 24.66 | 24.90 | 25.15 | 25.39 | 25.63 |
| Woodie | 20.90 | 21.73 | 23.57 | 24.40 | 26.24 | 27.07 | 28.91 |
| Fibonacci | 21.57 | 22.59 | 23.22 | 24.24 | 25.26 | 25.89 | 26.91 |
Numerical data
The following is the status of technical indicators and moving averages registered at the time this technical analysis was created:
| RSI (14): | 49.66 | |
| MACD (12,26,9): | 0.2000 | |
| Directional Movement: | -7.78 | |
| AROON (14): | -28.57 | |
| DEMA (21): | 24.63 | |
| Parabolic SAR (0,02-0,02-0,2): | 25.20 | |
| Elder Ray (13): | -0.44 | |
| Super Trend (3,10): | 23.44 | |
| Zig ZAG (10): | 24.17 | |
| VORTEX (21): | 0.9200 | |
| Stochastique (14,3,5): | 40.45 | |
| TEMA (21): | 24.59 | |
| Williams %R (14): | -55.73 | |
| Chande Momentum Oscillator (20): | -0.34 | |
| Repulse (5,40,3): | -1.6800 | |
| ROCnROLL: | -1 | |
| TRIX (15,9): | 0.1900 | |
| Courbe Coppock: | 5.12 |
| MA7: | 24.56 | |
| MA20: | 24.31 | |
| MA50: | 23.69 | |
| MA100: | 23.37 | |
| MAexp7: | 24.39 | |
| MAexp20: | 24.32 | |
| MAexp50: | 23.94 | |
| MAexp100: | 24.17 | |
| Price / MA7: | -1.59% | |
| Price / MA20: | -0.58% | |
| Price / MA50: | +2.03% | |
| Price / MA100: | +3.42% | |
| Price / MAexp7: | -0.90% | |
| Price / MAexp20: | -0.62% | |
| Price / MAexp50: | +0.96% | |
| Price / MAexp100: | -0% |
News
The last news published on UMICORE at the time of the generation of this analysis was as follows:
- Ignitis Group and Umicore Poland sign a corporate PPA for 137 MW Silesia WF II
- Ignitis Group and Umicore Poland sign a corporate PPA for 137 MW Silesia WF II
- Umicore share split
- Umicore - Acquisition of own shares
- Transparency notification by Schroders, plc: Acquisition of voting securities
About author
Online


Add a comment
Comments
0 comments on the analysis UMICORE - Daily