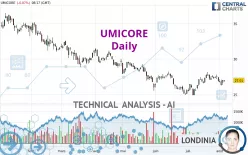
UMICORE - Daily - Technical analysis published on 08/04/2023 (GMT)
- 163
- 0
Click here for a new analysis!
- Timeframe : Daily
- - Analysis generated on
- Status : TARGET REACHED

Summary of the analysis

Additional analysis
Quotes
UMICORE rating 27.01 EUR. The price is lower by -0.07% since the last closing and was traded between 26.78 EUR and 27.05 EUR over the period. The price is currently at +0.86% from its lowest and -0.15% from its highest.The Central Gaps scanner detects a bearish opening marking the presence of sellers ahead of buyers at the opening but not sufficiently marked to allow the price to register a quotation gap.
Bearish opening
Type : Bearish
Timeframe : Openning
So that you have an overall view of the price change, here is a table showing the variations over several periods:
Near a new HIGH record (1 month)
Type : Bullish
Timeframe : Weekly
Technical
Technical analysis of UMICORE in Daily shows an overall bearish trend. 67.86% of the signals given by moving averages are bearish. Caution: as the signals currently given by short-term moving averages are rather neutral, the bearish trend could slow down. An assessment of moving averages reveals several bearish and bullish signals:
Bullish trend reversal : adaptative moving average 20
Type : Bullish
Timeframe : Daily
Bearish price crossover with Moving Average 20
Type : Bearish
Timeframe : Daily
An assessment of technical indicators does not currently provide any relevant information on the direction of future price movements.
The Central Indicators scanner found this result concerning these indicators:
Pivot points : price is under support 1
Type : Neutral
Timeframe : Weekly
The Central Patterns scanner, which studies chart patterns, resistances and supports, has identified this signal:
Near resistance of channel
Type : Bearish
Timeframe : Daily
No result was found by the Central Candlesticks scanner on Japanese candlesticks.
| S3 | S2 | S1 | Price | R1 | R2 | R3 | |
|---|---|---|---|---|---|---|---|
| ProTrendLines | 23.50 | 24.94 | 26.00 | 27.01 | 27.87 | 28.70 | 30.64 |
| Change (%) | -13.00% | -7.66% | -3.74% | - | +3.18% | +6.26% | +13.44% |
| Change | -3.51 | -2.07 | -1.01 | - | +0.86 | +1.69 | +3.63 |
| Level | Intermediate | Major | Minor | - | Major | Intermediate | Minor |
To determine price objectives, it is also possible to use the pivot points. Here is the price position in relation to pivot points:
| Pivot points | S3 | S2 | S1 | PP | R1 | R2 | R3 |
|---|---|---|---|---|---|---|---|
| Standard | 25.91 | 26.14 | 26.58 | 26.81 | 27.25 | 27.48 | 27.92 |
| Camarilla | 26.85 | 26.91 | 26.97 | 27.03 | 27.09 | 27.15 | 27.21 |
| Woodie | 26.03 | 26.19 | 26.70 | 26.86 | 27.37 | 27.53 | 28.04 |
| Fibonacci | 26.14 | 26.39 | 26.55 | 26.81 | 27.06 | 27.22 | 27.48 |
| Pivot points | S3 | S2 | S1 | PP | R1 | R2 | R3 |
|---|---|---|---|---|---|---|---|
| Standard | 26.34 | 26.68 | 27.14 | 27.48 | 27.94 | 28.28 | 28.74 |
| Camarilla | 27.37 | 27.44 | 27.52 | 27.59 | 27.66 | 27.74 | 27.81 |
| Woodie | 26.39 | 26.71 | 27.19 | 27.51 | 27.99 | 28.31 | 28.79 |
| Fibonacci | 26.68 | 26.99 | 27.18 | 27.48 | 27.79 | 27.98 | 28.28 |
| Pivot points | S3 | S2 | S1 | PP | R1 | R2 | R3 |
|---|---|---|---|---|---|---|---|
| Standard | 21.86 | 23.39 | 25.15 | 26.68 | 28.44 | 29.97 | 31.73 |
| Camarilla | 26.02 | 26.32 | 26.62 | 26.92 | 27.22 | 27.52 | 27.83 |
| Woodie | 21.99 | 23.45 | 25.28 | 26.74 | 28.57 | 30.03 | 31.86 |
| Fibonacci | 23.39 | 24.64 | 25.42 | 26.68 | 27.93 | 28.71 | 29.97 |
Numerical data
The following is the status of the technical indicators and moving averages at the time of publication of this technical analysis:
| RSI (14): | 50.93 | |
| MACD (12,26,9): | 0.1000 | |
| Directional Movement: | -3.68 | |
| AROON (14): | -64.28 | |
| DEMA (21): | 27.12 | |
| Parabolic SAR (0,02-0,02-0,2): | 27.90 | |
| Elder Ray (13): | -0.15 | |
| Super Trend (3,10): | 26.14 | |
| Zig ZAG (10): | 27.01 | |
| VORTEX (21): | 1.1300 | |
| Stochastique (14,3,5): | 36.08 | |
| TEMA (21): | 27.31 | |
| Williams %R (14): | -60.82 | |
| Chande Momentum Oscillator (20): | -0.74 | |
| Repulse (5,40,3): | 2.5100 | |
| ROCnROLL: | 2 | |
| TRIX (15,9): | 0.0900 | |
| Courbe Coppock: | 1.87 |
| MA7: | 27.09 | |
| MA20: | 27.09 | |
| MA50: | 26.76 | |
| MA100: | 27.92 | |
| MAexp7: | 27.05 | |
| MAexp20: | 26.99 | |
| MAexp50: | 27.16 | |
| MAexp100: | 28.06 | |
| Price / MA7: | -0.30% | |
| Price / MA20: | -0.30% | |
| Price / MA50: | +0.93% | |
| Price / MA100: | -3.26% | |
| Price / MAexp7: | -0.15% | |
| Price / MAexp20: | +0.07% | |
| Price / MAexp50: | -0.55% | |
| Price / MAexp100: | -3.74% |
News
The latest news and videos published on UMICORE at the time of the analysis were as follows:
- Umicore share split
- Umicore - Acquisition of own shares
- Transparency notification by Schroders, plc: Acquisition of voting securities
- Umicore - Acquisition of own shares
- Umicore - Acquisition of own shares
About author
Online


Add a comment
Comments
0 comments on the analysis UMICORE - Daily