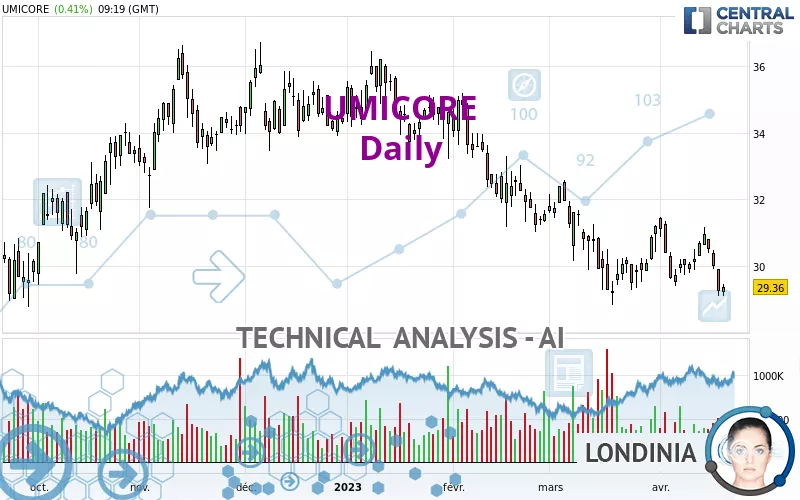
UMICORE - Daily - Technical analysis published on 04/24/2023 (GMT)
- 151
- 0
Click here for a new analysis!
- Timeframe : Daily
- - Analysis generated on
- Status : LEVEL MAINTAINED
Summary of the analysis

Additional analysis
Quotes
The UMICORE rating is 29.36 EUR. The price has increased by +0.41% since the last closing and was between 29.10 EUR and 29.46 EUR. This implies that the price is at +0.89% from its lowest and at -0.34% from its highest.A study of price movements over other periods shows the following variations:
Near a new LOW record (1 year)
Type : Bearish
Timeframe : Weekly
Near a new LOW record (1st january)
Type : Bearish
Timeframe : Weekly
Near a new LOW record (1 month)
Type : Bearish
Timeframe : Weekly
Technical
A technical analysis in Daily of this UMICORE chart shows a sharp bearish trend. 92.86% of the signals given by moving averages are bearish. The overall trend is supported by the strong bearish signals from short-term moving averages. The Central Indicators market scanner is currently detecting a bearish signal that could impact this trend:
Bearish trend reversal : Moving Average 20
Type : Bearish
Timeframe : Daily
On the 18 technical indicators analysed, 5 are bullish, 3 are neutral and 10 are bearish. Caution: the Central Indicators scanner currently detects an excess:
CCI indicator is oversold : under -100
Type : Neutral
Timeframe : Daily
Williams %R indicator is oversold : under -80
Type : Neutral
Timeframe : Daily
MACD crosses DOWN its Moving Average
Type : Bearish
Timeframe : Daily
Central Patterns, the market scanner focusing on chart patterns, resistances and supports found this result:
Near support of channel
Type : Bullish
Timeframe : Daily
The Central Candlesticks scanner, specialised in Japanese candlesticks, did not identify any signals.
| S3 | S2 | S1 | Price | R1 | R2 | R3 | |
|---|---|---|---|---|---|---|---|
| ProTrendLines | 17.54 | 23.94 | 29.24 | 29.36 | 31.21 | 34.00 | 36.18 |
| Change (%) | -40.26% | -18.46% | -0.41% | - | +6.30% | +15.80% | +23.23% |
| Change | -11.82 | -5.42 | -0.12 | - | +1.85 | +4.64 | +6.82 |
| Level | Intermediate | Major | Major | - | Minor | Minor | Major |
To determine price objectives, it is also possible to use the pivot points. Here is the price position in relation to pivot points:
| Pivot points | S3 | S2 | S1 | PP | R1 | R2 | R3 |
|---|---|---|---|---|---|---|---|
| Standard | 28.11 | 28.61 | 28.92 | 29.42 | 29.73 | 30.23 | 30.54 |
| Camarilla | 29.02 | 29.09 | 29.17 | 29.24 | 29.31 | 29.39 | 29.46 |
| Woodie | 28.03 | 28.56 | 28.84 | 29.37 | 29.65 | 30.18 | 30.46 |
| Fibonacci | 28.61 | 28.92 | 29.11 | 29.42 | 29.73 | 29.92 | 30.23 |
| Pivot points | S3 | S2 | S1 | PP | R1 | R2 | R3 |
|---|---|---|---|---|---|---|---|
| Standard | 26.43 | 27.77 | 28.50 | 29.84 | 30.57 | 31.91 | 32.64 |
| Camarilla | 28.67 | 28.86 | 29.05 | 29.24 | 29.43 | 29.62 | 29.81 |
| Woodie | 26.14 | 27.62 | 28.21 | 29.69 | 30.28 | 31.76 | 32.35 |
| Fibonacci | 27.77 | 28.56 | 29.05 | 29.84 | 30.63 | 31.12 | 31.91 |
| Pivot points | S3 | S2 | S1 | PP | R1 | R2 | R3 |
|---|---|---|---|---|---|---|---|
| Standard | 25.41 | 27.12 | 29.16 | 30.87 | 32.91 | 34.62 | 36.66 |
| Camarilla | 30.18 | 30.52 | 30.87 | 31.21 | 31.55 | 31.90 | 32.24 |
| Woodie | 25.59 | 27.20 | 29.34 | 30.95 | 33.09 | 34.70 | 36.84 |
| Fibonacci | 27.12 | 28.55 | 29.43 | 30.87 | 32.30 | 33.18 | 34.62 |
Numerical data
The following is the status of the technical indicators and moving averages at the time of publication of this technical analysis:
| RSI (14): | 40.52 | |
| MACD (12,26,9): | -0.2900 | |
| Directional Movement: | -13.40 | |
| AROON (14): | -85.72 | |
| DEMA (21): | 29.76 | |
| Parabolic SAR (0,02-0,02-0,2): | 31.05 | |
| Elder Ray (13): | -0.76 | |
| Super Trend (3,10): | 31.19 | |
| Zig ZAG (10): | 29.41 | |
| VORTEX (21): | 0.9000 | |
| Stochastique (14,3,5): | 16.10 | |
| TEMA (21): | 29.93 | |
| Williams %R (14): | -86.92 | |
| Chande Momentum Oscillator (20): | -1.04 | |
| Repulse (5,40,3): | -1.8900 | |
| ROCnROLL: | 2 | |
| TRIX (15,9): | -0.1300 | |
| Courbe Coppock: | 2.08 |
| MA7: | 30.13 | |
| MA20: | 30.14 | |
| MA50: | 30.87 | |
| MA100: | 32.79 | |
| MAexp7: | 29.88 | |
| MAexp20: | 30.17 | |
| MAexp50: | 30.99 | |
| MAexp100: | 32.02 | |
| Price / MA7: | -2.56% | |
| Price / MA20: | -2.59% | |
| Price / MA50: | -4.89% | |
| Price / MA100: | -10.46% | |
| Price / MAexp7: | -1.74% | |
| Price / MAexp20: | -2.68% | |
| Price / MAexp50: | -5.26% | |
| Price / MAexp100: | -8.31% |
News
The latest news and videos published on UMICORE at the time of the analysis were as follows:
- Umicore share split
- Umicore - Acquisition of own shares
- Transparency notification by Schroders, plc: Acquisition of voting securities
- Umicore - Acquisition of own shares
- Umicore - Acquisition of own shares
About author
Online


Add a comment
Comments
0 comments on the analysis UMICORE - Daily