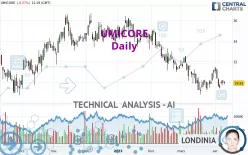
UMICORE - Daily - Technical analysis published on 04/13/2023 (GMT)
- 156
- 0
Click here for a new analysis!
- Timeframe : Daily
- - Analysis generated on
- Status : TARGET REACHED

Summary of the analysis

Additional analysis
Quotes
The UMICORE rating is 29.93 EUR. On the day, this instrument lost -0.27% and was traded between 29.77 EUR and 30.12 EUR over the period. The price is currently at +0.54% from its lowest and -0.63% from its highest.The Central Gaps scanner detects a bullish opening marking the presence of buyers ahead of sellers at the opening but not sufficiently marked to allow the price to register a quotation gap.
Bullish opening
Type : Bullish
Timeframe : Openning
A study of price movements over other periods shows the following variations:
Near a new LOW record (1 year)
Type : Bearish
Timeframe : Weekly
Near a new LOW record (1st january)
Type : Bearish
Timeframe : Weekly
Near a new LOW record (1 month)
Type : Bearish
Timeframe : Weekly
Technical
Technical analysis of UMICORE in Daily shows a overall strongly bearish trend. The signals given by moving averages are 92.86% bearish. This strong bearish trend is confirmed by the strong signals currently being given by short-term moving averages. The Central Indicators market scanner currently does not detect any result that concerns moving averages.
An assessment of technical indicators does not currently provide any relevant information on the direction of future price movements.
Other results related to technical indicators were also found by the Central Indicators scanner:
Ichimoku - Bullish crossover : Tenkan & Kijun
Type : Bullish
Timeframe : Daily
Price is back under the pivot point
Type : Bearish
Timeframe : Daily
Momentum indicator is back over 0
Type : Bullish
Timeframe : Daily
No signals are given by Central Patterns, a market scanner specialised in chart patterns, resistances and supports.
The Central Candlesticks scanner, specialised in Japanese candlesticks, did not identify any signals.
| S3 | S2 | S1 | Price | R1 | R2 | R3 | |
|---|---|---|---|---|---|---|---|
| ProTrendLines | 17.54 | 23.94 | 29.24 | 29.93 | 31.21 | 32.39 | 34.00 |
| Change (%) | -41.40% | -20.01% | -2.31% | - | +4.28% | +8.22% | +13.60% |
| Change | -12.39 | -5.99 | -0.69 | - | +1.28 | +2.46 | +4.07 |
| Level | Intermediate | Major | Major | - | Intermediate | Minor | Minor |
Pivot points can also be used to set your price objectives. Here is the price situation in relation to pivot points:
| Pivot points | S3 | S2 | S1 | PP | R1 | R2 | R3 |
|---|---|---|---|---|---|---|---|
| Standard | 29.26 | 29.48 | 29.75 | 29.97 | 30.24 | 30.46 | 30.73 |
| Camarilla | 29.88 | 29.92 | 29.97 | 30.01 | 30.06 | 30.10 | 30.15 |
| Woodie | 29.28 | 29.49 | 29.77 | 29.98 | 30.26 | 30.47 | 30.75 |
| Fibonacci | 29.48 | 29.67 | 29.79 | 29.97 | 30.16 | 30.28 | 30.46 |
| Pivot points | S3 | S2 | S1 | PP | R1 | R2 | R3 |
|---|---|---|---|---|---|---|---|
| Standard | 26.69 | 28.04 | 28.77 | 30.12 | 30.85 | 32.20 | 32.93 |
| Camarilla | 28.93 | 29.12 | 29.31 | 29.50 | 29.69 | 29.88 | 30.07 |
| Woodie | 26.38 | 27.89 | 28.46 | 29.97 | 30.54 | 32.05 | 32.62 |
| Fibonacci | 28.04 | 28.84 | 29.33 | 30.12 | 30.92 | 31.41 | 32.20 |
| Pivot points | S3 | S2 | S1 | PP | R1 | R2 | R3 |
|---|---|---|---|---|---|---|---|
| Standard | 25.41 | 27.12 | 29.16 | 30.87 | 32.91 | 34.62 | 36.66 |
| Camarilla | 30.18 | 30.52 | 30.87 | 31.21 | 31.55 | 31.90 | 32.24 |
| Woodie | 25.59 | 27.20 | 29.34 | 30.95 | 33.09 | 34.70 | 36.84 |
| Fibonacci | 27.12 | 28.55 | 29.43 | 30.87 | 32.30 | 33.18 | 34.62 |
Numerical data
The following is the status of the technical indicators and moving averages at the time of publication of this technical analysis:
| RSI (14): | 43.42 | |
| MACD (12,26,9): | -0.3700 | |
| Directional Movement: | -10.69 | |
| AROON (14): | 42.85 | |
| DEMA (21): | 29.74 | |
| Parabolic SAR (0,02-0,02-0,2): | 31.35 | |
| Elder Ray (13): | -0.20 | |
| Super Trend (3,10): | 31.84 | |
| Zig ZAG (10): | 29.94 | |
| VORTEX (21): | 0.9500 | |
| Stochastique (14,3,5): | 33.63 | |
| TEMA (21): | 29.95 | |
| Williams %R (14): | -70.14 | |
| Chande Momentum Oscillator (20): | 0.45 | |
| Repulse (5,40,3): | -1.6200 | |
| ROCnROLL: | 2 | |
| TRIX (15,9): | -0.2100 | |
| Courbe Coppock: | 1.85 |
| MA7: | 30.09 | |
| MA20: | 30.01 | |
| MA50: | 31.41 | |
| MA100: | 33.07 | |
| MAexp7: | 30.04 | |
| MAexp20: | 30.31 | |
| MAexp50: | 31.27 | |
| MAexp100: | 32.29 | |
| Price / MA7: | -0.53% | |
| Price / MA20: | -0.27% | |
| Price / MA50: | -4.71% | |
| Price / MA100: | -9.50% | |
| Price / MAexp7: | -0.37% | |
| Price / MAexp20: | -1.25% | |
| Price / MAexp50: | -4.29% | |
| Price / MAexp100: | -7.31% |
News
The last news published on UMICORE at the time of the generation of this analysis was as follows:
- Umicore share split
- Umicore - Acquisition of own shares
- Transparency notification by Schroders, plc: Acquisition of voting securities
- Umicore - Acquisition of own shares
- Umicore - Acquisition of own shares
About author
Online


Add a comment
Comments
0 comments on the analysis UMICORE - Daily